Risky Weekend
Here's what the market is saying going into the weekend. Let's just say, it's not what you hoped to hear.


My quality of life has improved.
I give credit to better sleep.
No, I didn't go out and buy the new mattress that Anthony Pompliano was shilling...
I stopped setting alerts.
Specifically, the kind that wake you up in deep REM sleep due to volatile events. There were too many times where I would get alerted, attempt to make sense of the market, and figure out what action to make.
It was a recipe for failure. You can't expect to get a pulse of the market shortly after waking up.
This was a lesson I learned many years ago. And I'm reminded of this very lesson as I go through recent trades performed by J-AI in an attempt to figure out what it saw happening in the market this week.
To help draw some conclusions, I pulled up some recently closed trades.
What quickly became clear - trades were happening while I was asleep.
It's pretty cool to think that your trades can be managed while you attempt to read a wristwatch in order to determine whether you're asleep or not...
Let me explain that last line a bit more...
For those that don't know what I'm talking about, consider making it a habit to read the time on your wrist at various times throughout the day. That way, when you dream, you tend to do it as well - during the dream.
The reason being, you can't read time when you dream.
Which means when you check the time in your dream, and you can't read it, your brain will grant itself permission to ride the monster wave at Tahiti's Teahupo'o.

Lucid dreaming takes some training. I typically wake up shortly after I find out I'm dreaming, but it's pretty awesome to subconsciously/consciously(?) know you're dreaming while in the middle of a dream...
And let's just say, I'd like to do this with the wearable Prophetic AI device that stabilizes lucid dreams. It would be quite the night... One where an alert is an unwanted guest.
Getting back to the purpose for today's write up...
Below were some of the more recent trades. J-AI took positions on BTC and SOL as the trade books began to show strength, and the flow of orders began to look strong. We drew attention to this in Knife Catching During The Inferno.
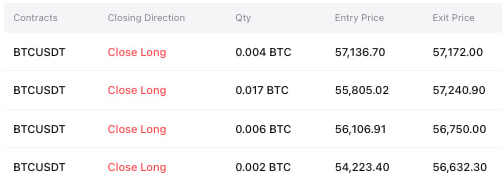
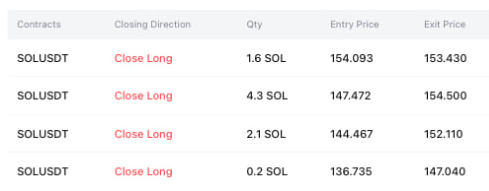
The software also got active on some more volatile assets, but those are a bit outside the scope of our analysis today... Those volatile asset trades operate on a much faster frequency, looking to get lots and lots of small wins.
Now, if we were to try and understand what J-AI was looking at when it closed those knife catch trades, we can plot some of the trades on a chart.
We went ahead and did so below, and began to run through some metrics we use to build the 48 models/80+ algorithms that feed into it the software in order to find out why it de-risked.
The metric that stood out to us the most was bid-to-ask ratio. It was the same metric we discussed Wednesday in Bumpy Ride. In the essay, we showcased how the market structure was looking better, but a run above the weekly close at $62k might not be in the cards due to whales on the tape beginning to disappear.
This was and is hinting to us that consolidation on price and volatility are likely. Which also meant we expected J-AI to de-risk in the coming days... Which is what we got.
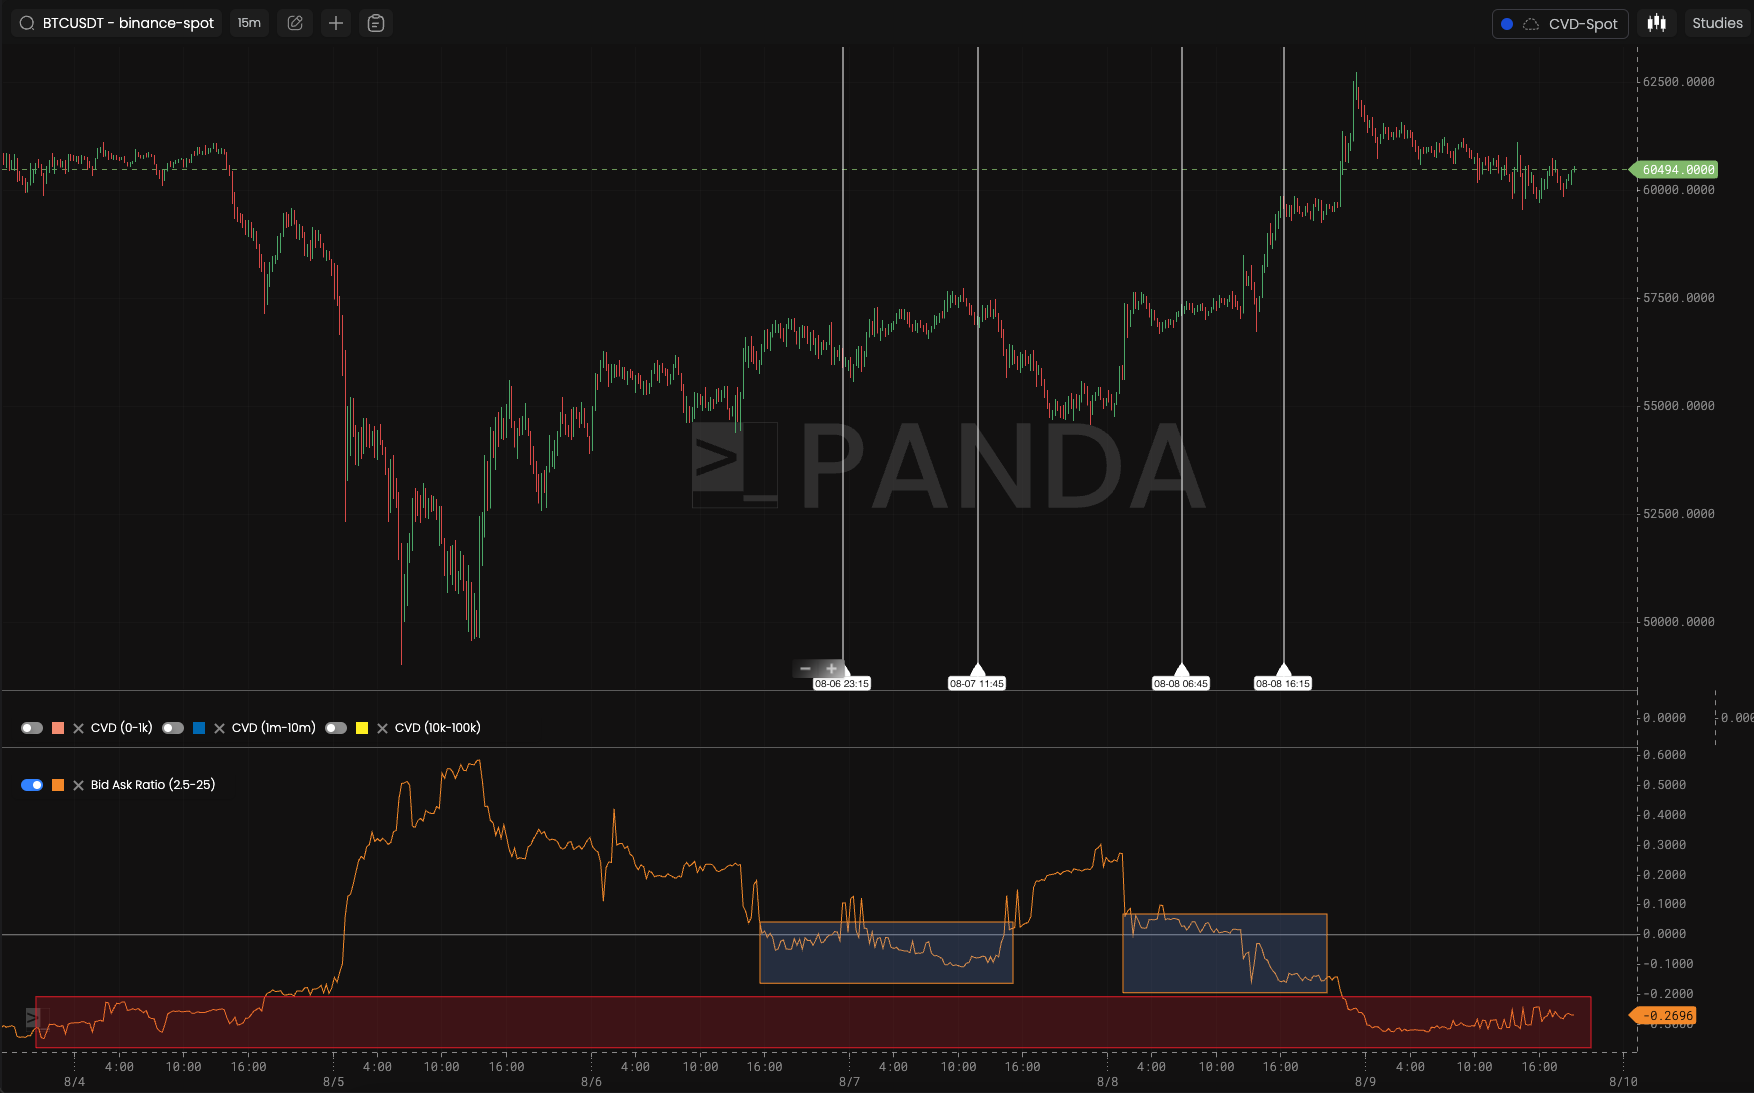
In the chart below, the white vertical lines are some areas where J-AI was active in closing trades. Don't worry about zooming in on the chart as I'll do that for us as we dive into it further.
Just note there are two charts here because the left side is the spot market and the right side is the futures market. It's helpful to look at these side by side.
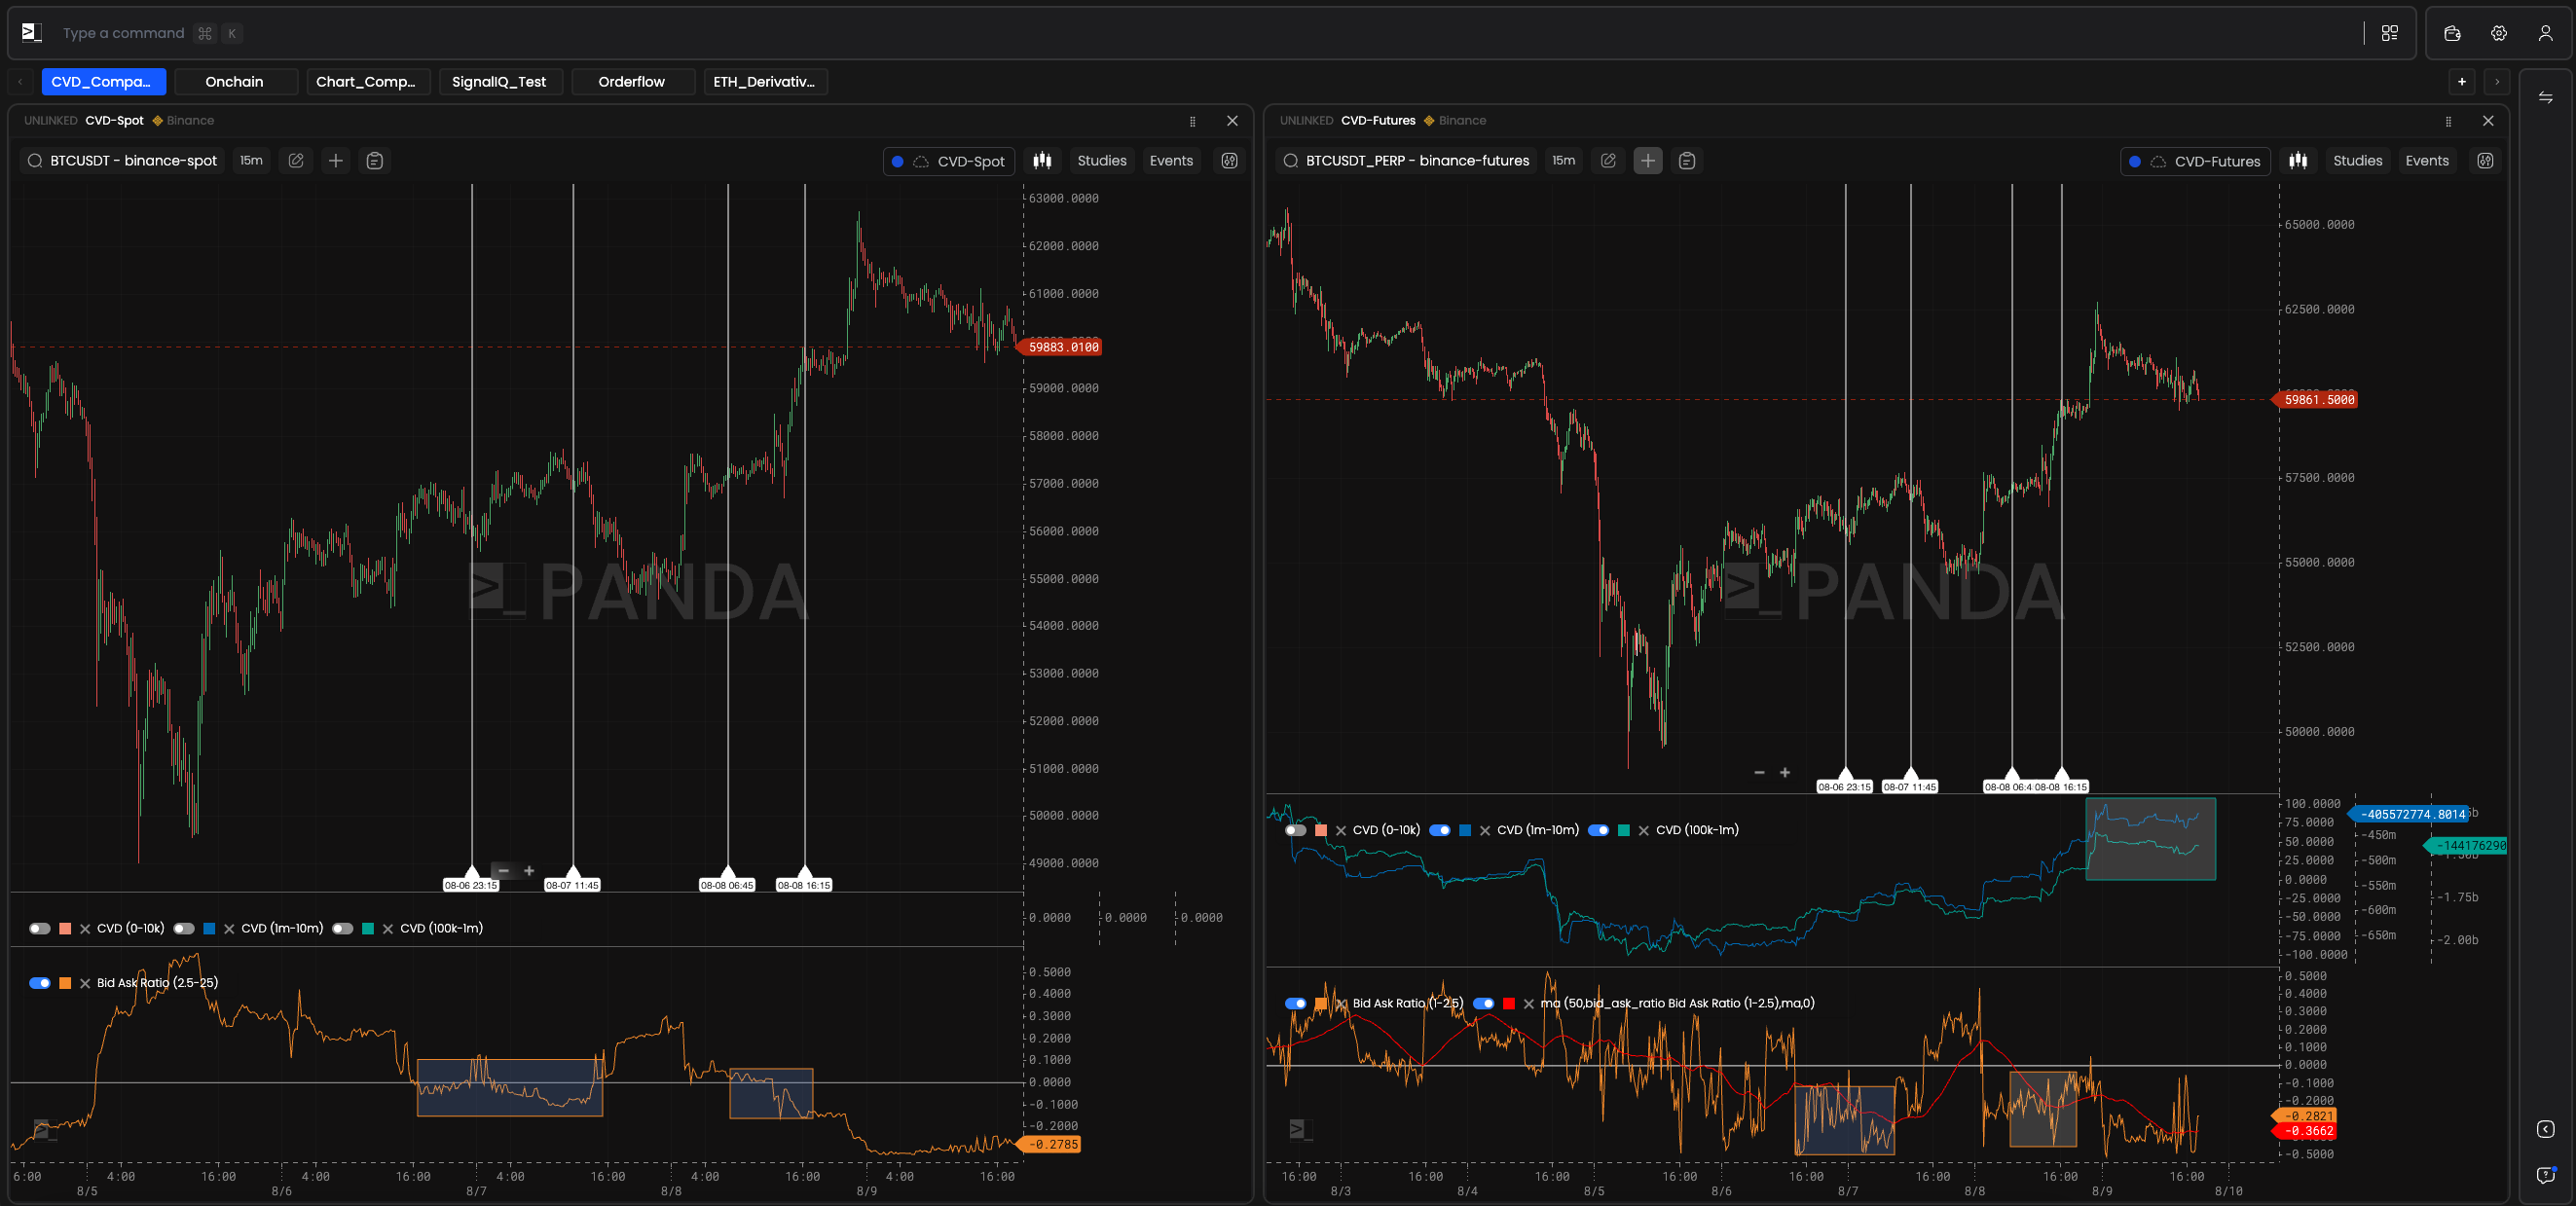
Now, before I get into the bid-ask-ratio, let's consider what makes spot versus futures different.
In the futures market, leverage is the game. There is much more activity closer to the current price at any given time. That's thanks to leverage.
For that reason, we want to examine the depth of the order books in a smaller window to the current price. The orange line below does this by comparing the amount of bids and asks within 1-2.5% from price.
In the chart we can see that the white vertical lines are showing up when the orange line is trending below zero. Those areas are the white boxes at the bottom, which signify more asks than bids.

We will come back to the teal and blue lines seen above at the end of the essay when we discuss what to expect for the weekend. For now, focus on how the market turned soft on the books (asks outweighing bids) on the futures market.
When we turn to spot, it's good to note that we don't need to look at the book in such close proximity to the current price. We can widen our scope a lot more, especially given how much price has moved this week
When doing this, it's important to note that the ratio will tend to skew towards negative numbers more so than the positive (bid heavy) side. This has to do with purchasing power of asks vs a bid.
Now, as this ratio dropped negative, trades were getting closed out, again. That's seen when the orange line was in the white boxes below.

This tells us that the backstory for this week can best be summed up with a few things.
First, the books got strong once BTC was headed below $55k earlier this week. Once there, improving orderflow helped rebound prices off the low. Said differently, traders are smashing the asks that sat on the book.
The $100k-$10m demographic was one of the strongest in this rally off the low - on futures.
As price recovered, traders took profit. That's what we've seen the last two days.
The issue though, is that the bids did not follow price higher.
Which brings us to today... This lack of movement has led to higher market risk as we move into...
The Weekend
Two things stand out to me as we move to the weekend.
The first, on futures, is that the group that led this rebound is inactive. That's what the teal and blue lines in the chart below show in the white box.
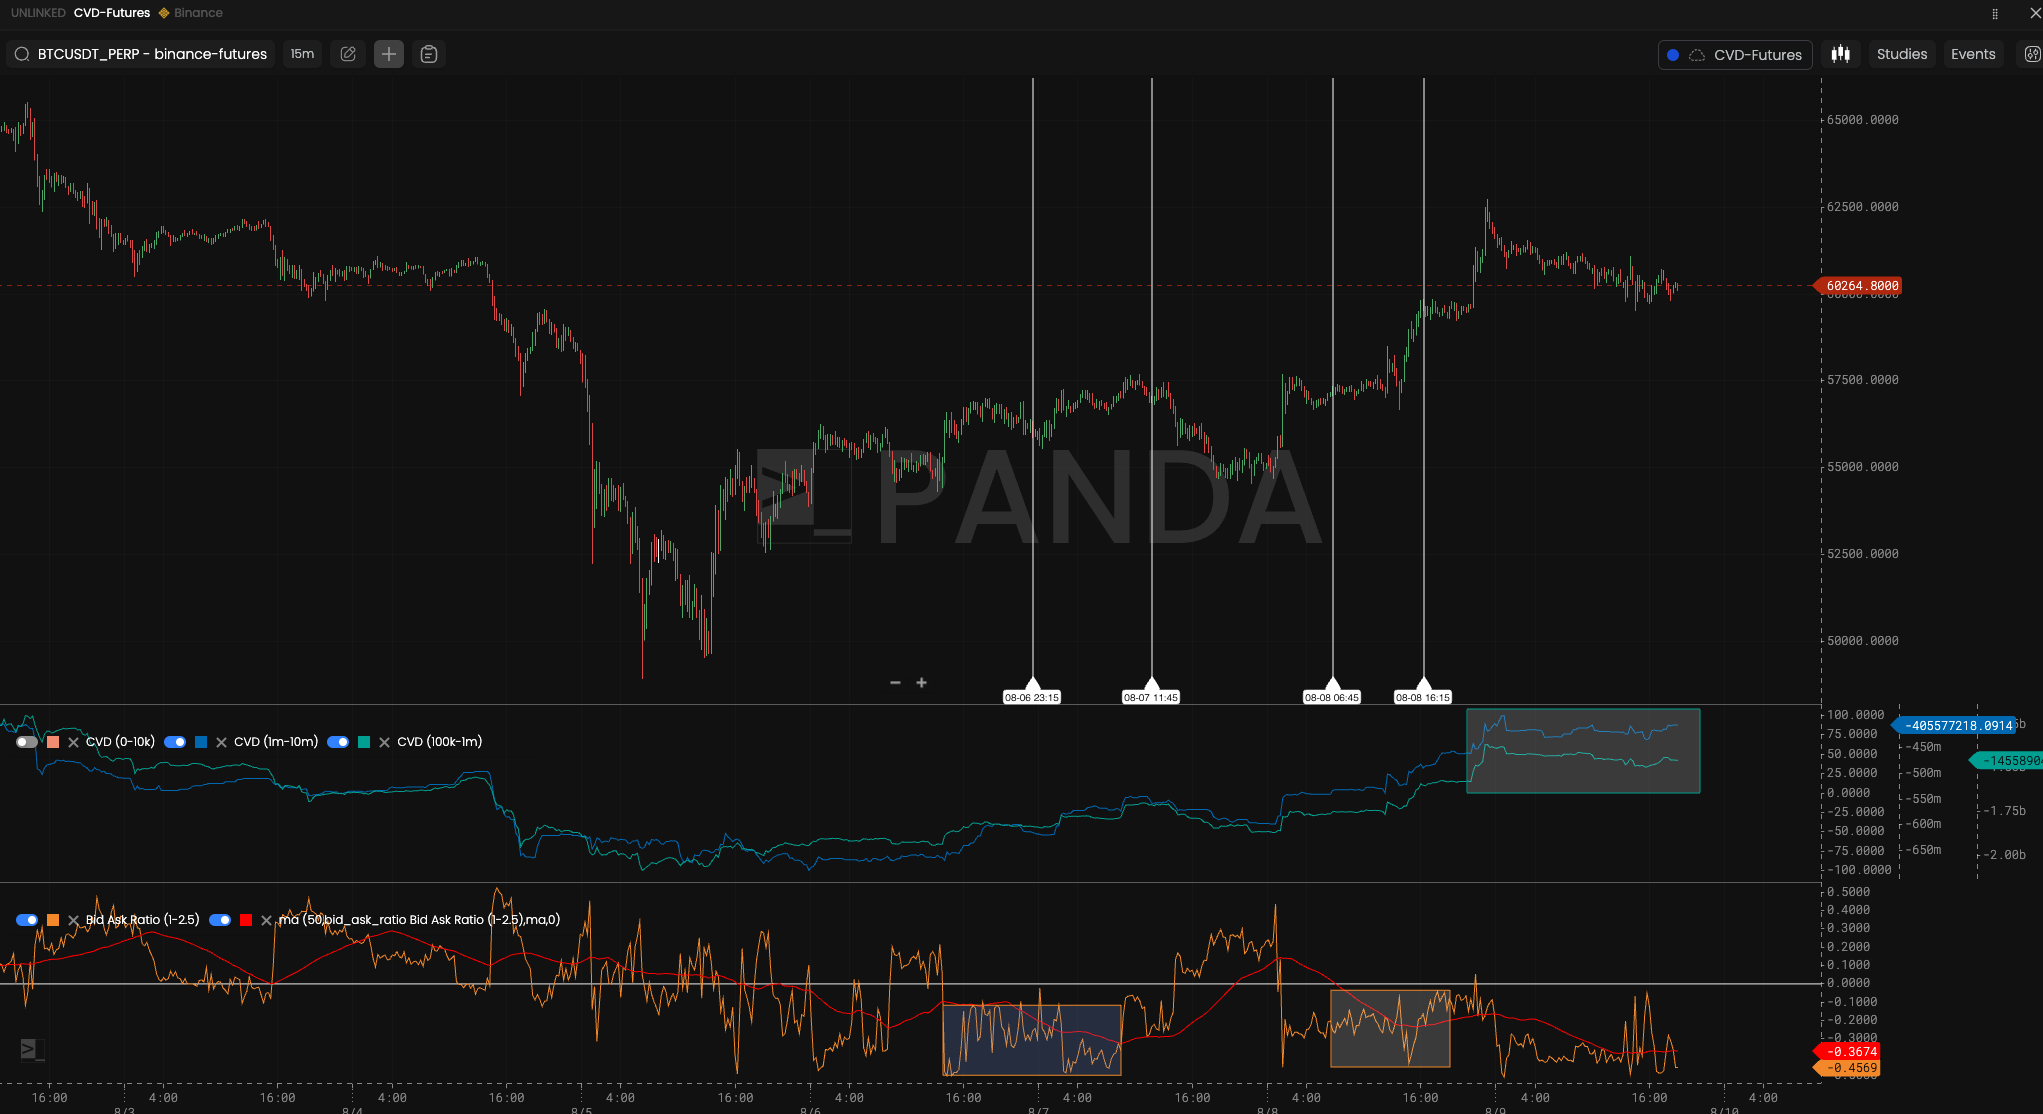
Second, the order books are getting much softer today - Friday. That's the scary red box in the image below.
Lastly, we rejected off the 200d moving average yesterday. Which also sits in what we can classify as a supply zone.
Supply zones are where price tends to look like it's stuck in mud... Traders open/close positions around here to set future trends. And I don't like to see price slow down into this zone today.
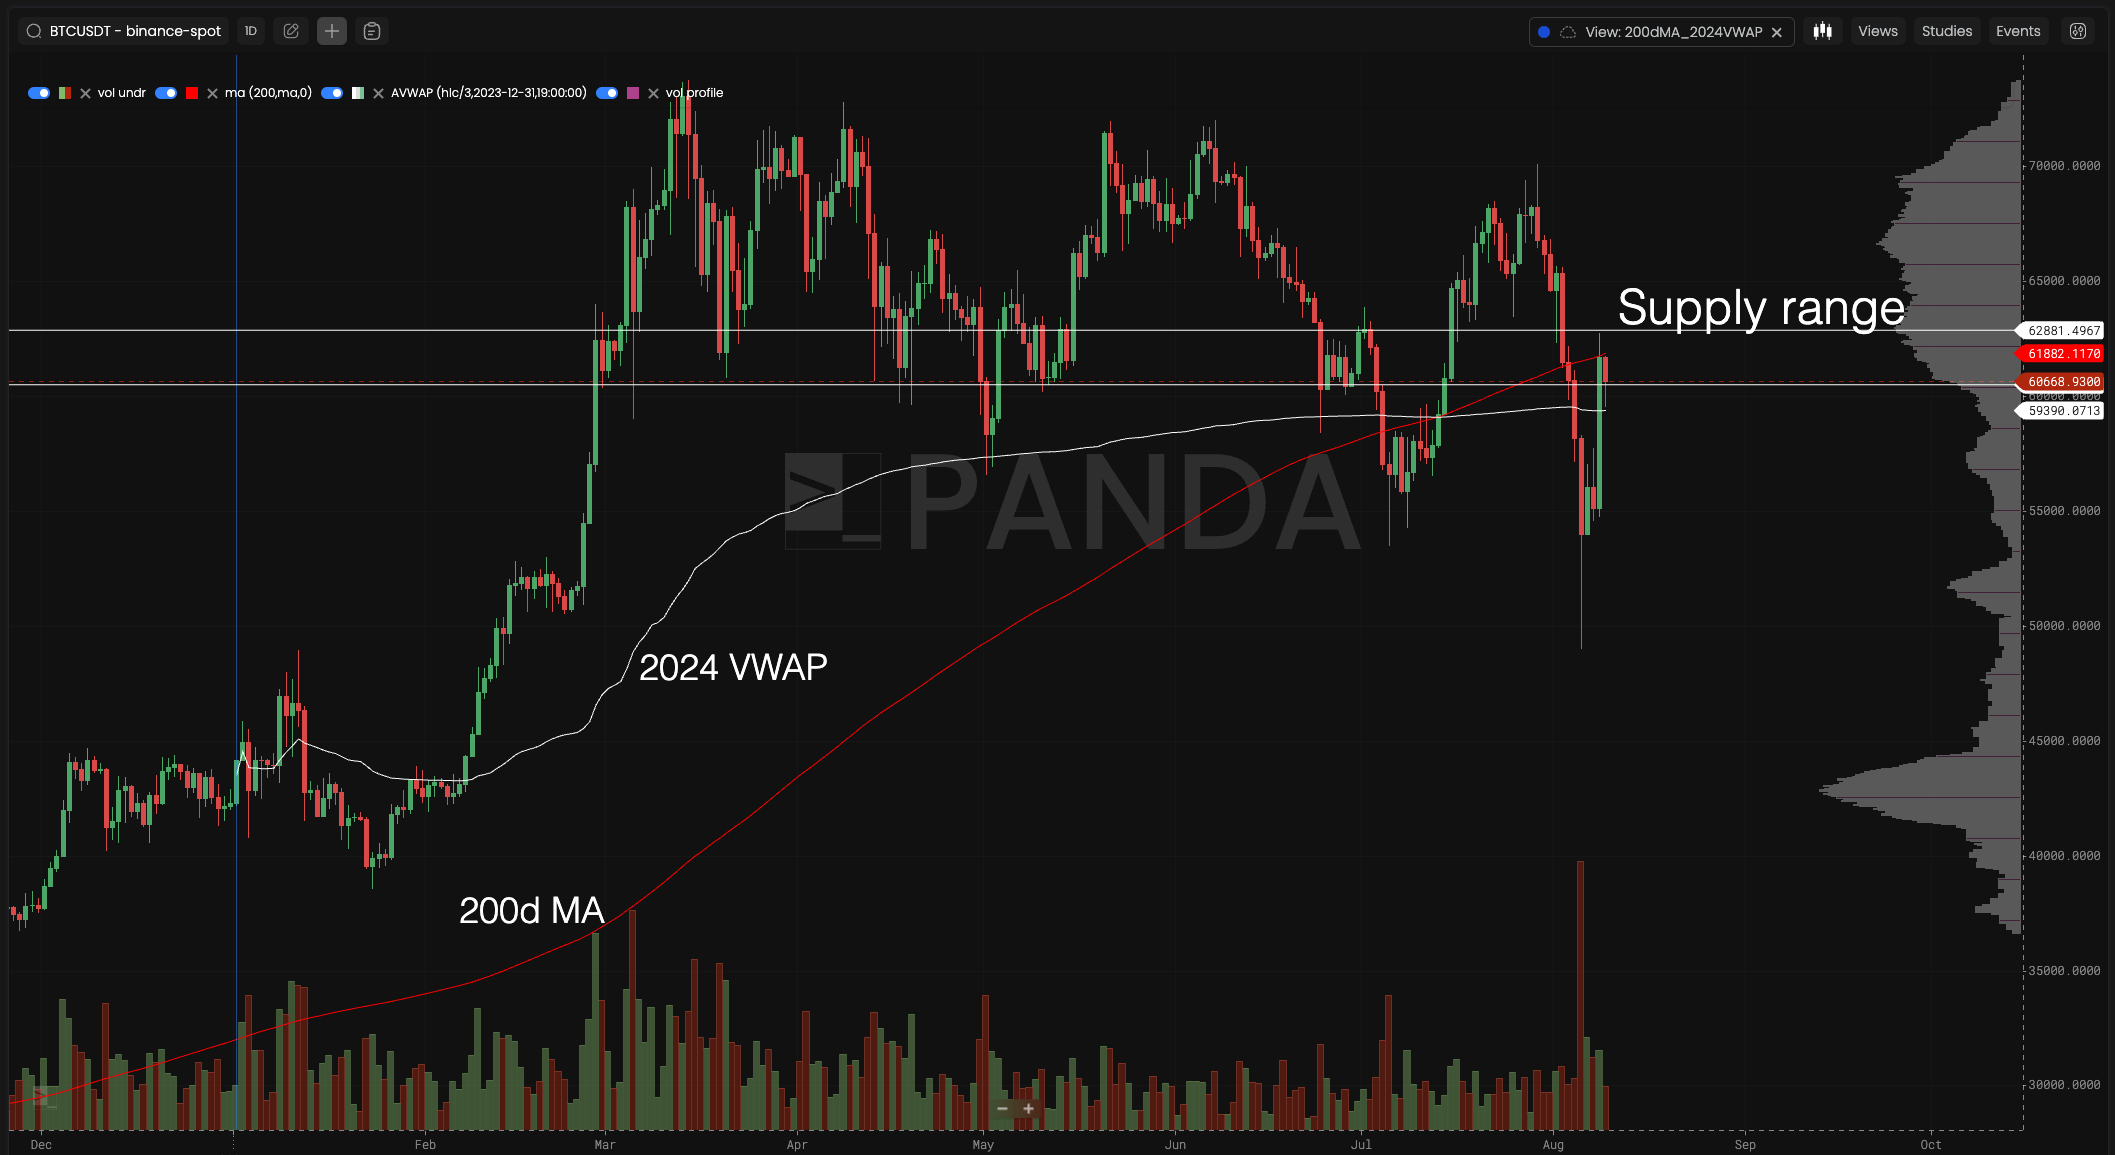
With the tape not showing strength, asks outweighing bids, and price not breaking 200d moving average into the weekend, it's an environment that is getting riskier as we head into lower liquidity trading days.
If last weekend was to serve as a lesson for us, the Sunday evening hours when Asia opens up its trade week will be one to hone in on for what we have in store for the week.
Until then, we hope the boat holds steady here.
Your Pulse on Crypto,
Ben Lilly
P.S. - ICYMI, Amit and Benjamin talked markets yesterday during the Trading Pit livestream. You can listen to it below. Also, I'll be filling in for Marconi (apologies in advance!) for the next two livestreams as he enjoys a bit of time away from our pixelated faces.


