Relentless
Three Years, the future, and an update


Three years have now passed.
The early days of Jarvis Labs was more reminiscent of an experiment.
At the time onchain analysis was still in its infancy. The larger data providers like CoinMetrics and Glassnode I believe still hadn’t even witnessed VC inflows.
In fact most of them still had second jobs.
Businesses were bootstrapping themselves with grit and determination at a time when the cryptocurrency market was barreling towards a Crypto Winter.
For those unfamiliar with this stretch, Crypto Winter was when volumes and overall interest in crypto shrank to levels not seen since the end of 2015 / start of 2016.
It was also just before price fell off a proverbial cliff. In November that year price dropped from $6.4k to $3.2k in just a few days. Most of us around at the time literally started to question whether the industry would survive.
Businesses were beginning to go belly up one after another.
It was crypto’s nuclear winter.
And this capitulation period marked the time when Jarvis Labs was born. As Bane from Batman said, [we] were molded by it.
So watching onchain activity, exchange volumes, and sentiment nose dive to Crypto Winter levels as Jarvis Labs hits its three year anniversary almost feels like a welcome home moment.
But to get out of the sentimental chit-chat for a minute, I bring up our anniversary because you will start to see Jarvis Labs making a transition over the second half of 2020.
The last four months our team has been relentless in taking the next leap for the business. This required an absurd amount of phone calls, meetings, and paperwork. Even partnering up with a new entity to make it a reality.
Thankfully, we have almost cleared this period where from the outside looking in, it might seem like we are running in circles. But make no mistake, our feeling is that of a crouched runner ready to take off running free of any weights or resistances.
We feel on the verge of a breakout.
Your first glimpse of what we mean is coming in just a few days.
It might look like a simple new website with a landing page, but make no mistake, it marks a literal new era for Jarvis Labs.
So get ready to hear more in the coming days.
To give a quick tease…

Also, we’re working on an entirely new form of analysis using onchain. Its token fundamental analysis.
Some of you may recall an older issue called “The Valuation Series”. In it we discussed how cryptocurrency assets are unique. And using valuation tools developed from other markets to determine the value of a token can work in some situations, but not all.
So we decided to essentially start from scratch.
In order to do so we are looking at token price and ultimately figuring out what traits determine its price. That’s it.
Here’s a sneak peek of a few things in the works…
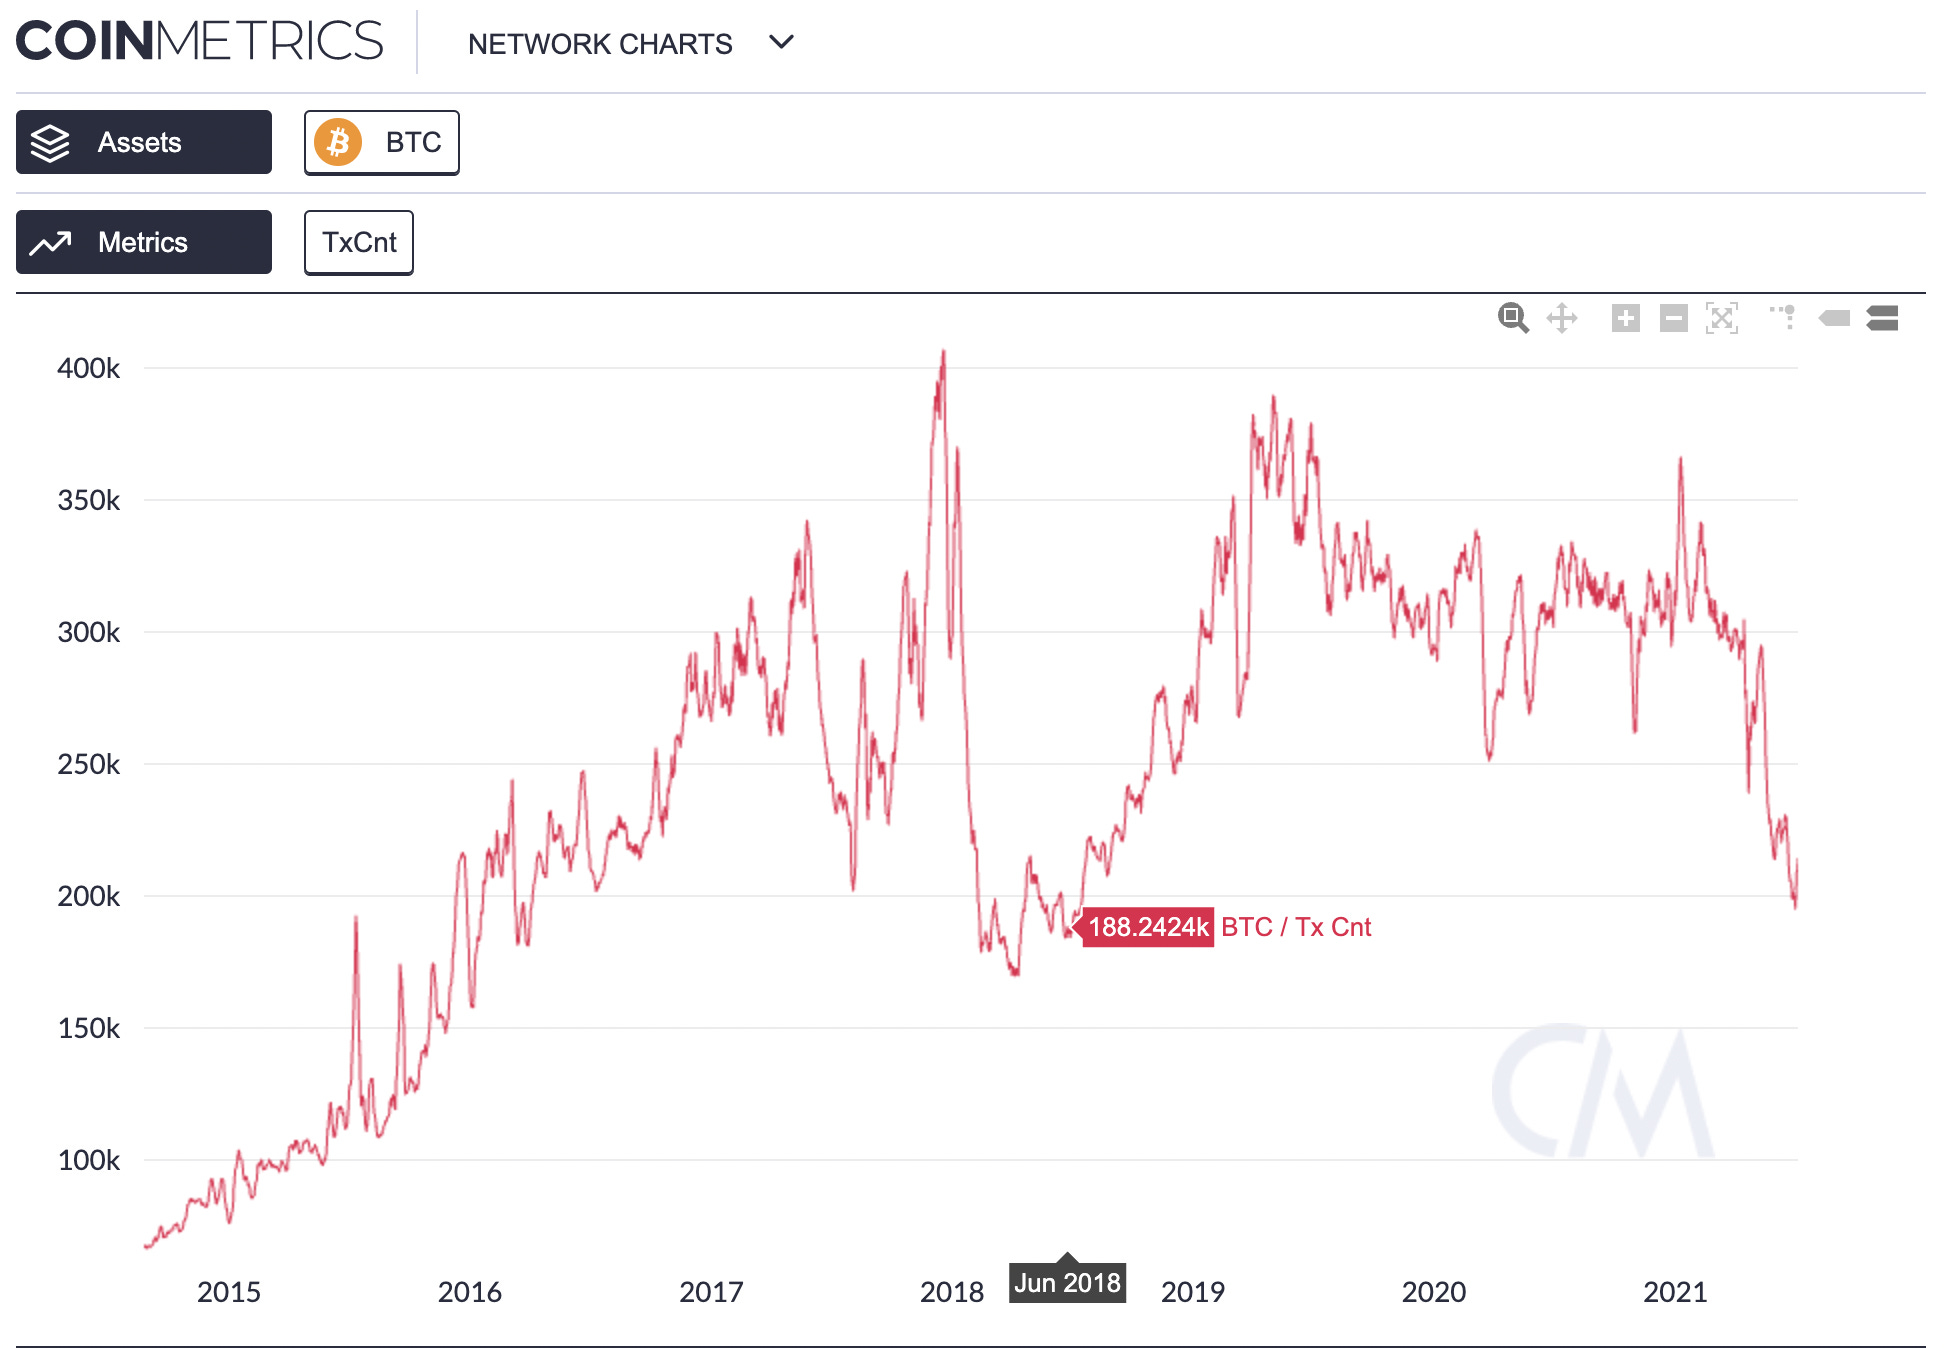
LL Ratio.
This is locked supply versus liquid supply as a ratio and plotted against price. The solid line below is the ratio and as more supply became unlocked and liquid, the line went lower.
It is a ratio that tends to precede price as we can see in the chart below.
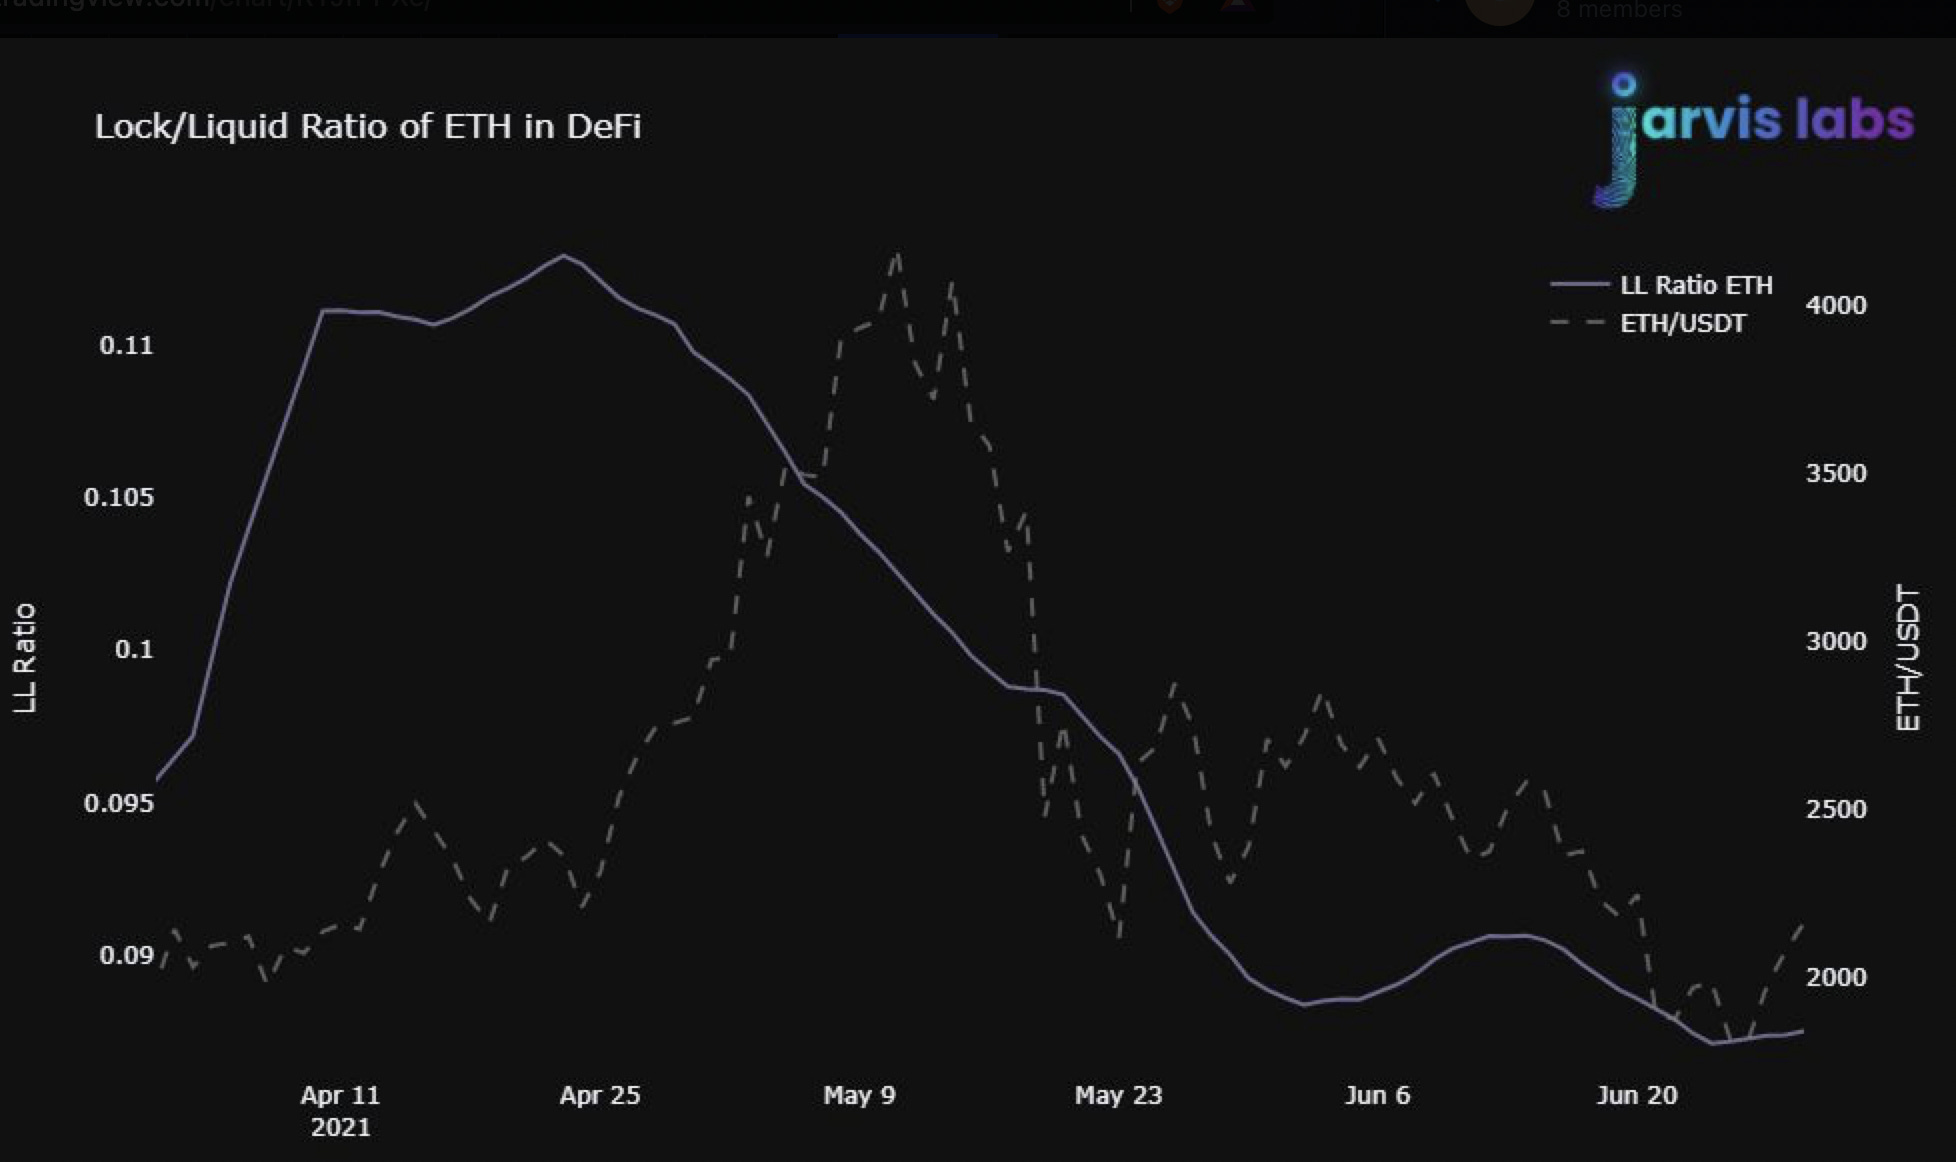
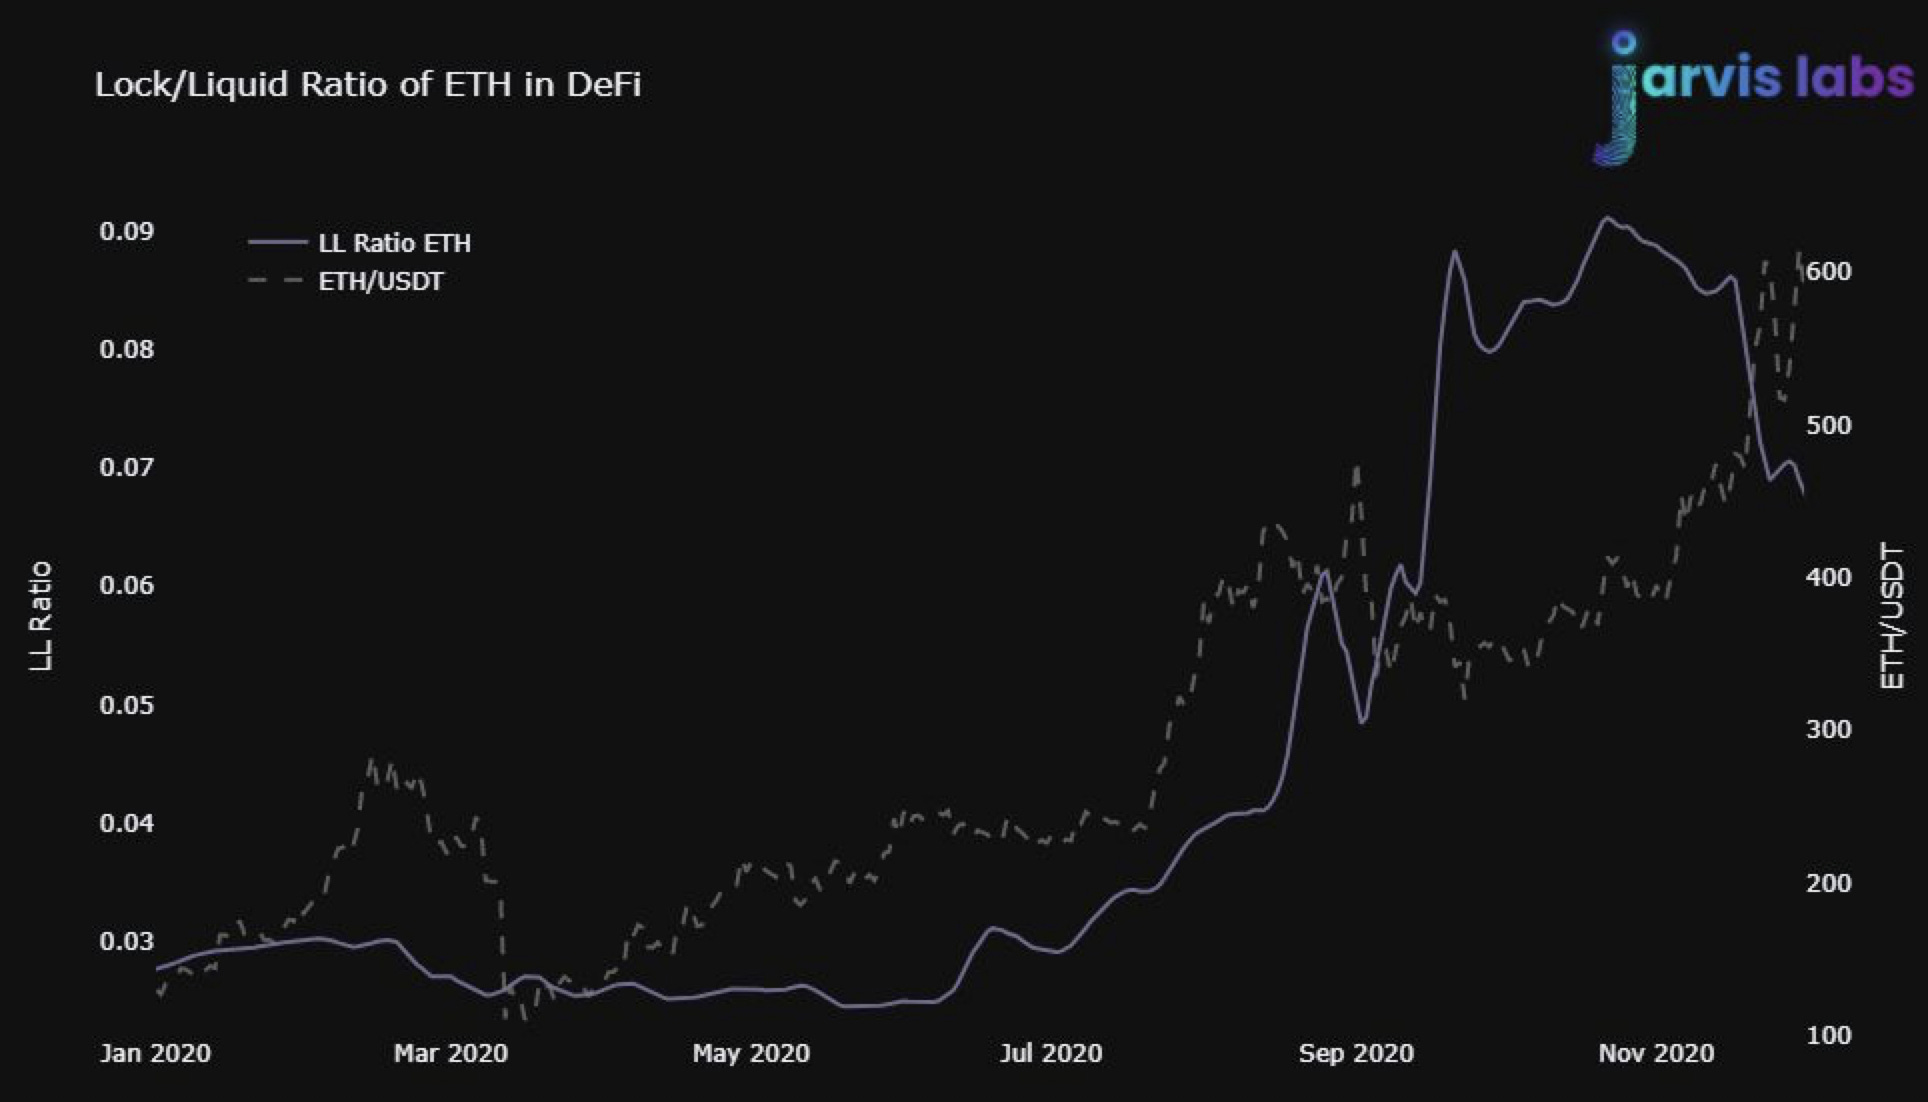
In the next chart we can see this ratio when we hit DeFi summer in 2020. This time the pop higher in the ratio preceded a major breakout. And then in September the ratio preceded another major leg higher.
It is pretty cool to see a hypothesis like this panning out. And now we are diving into smaller protocols.
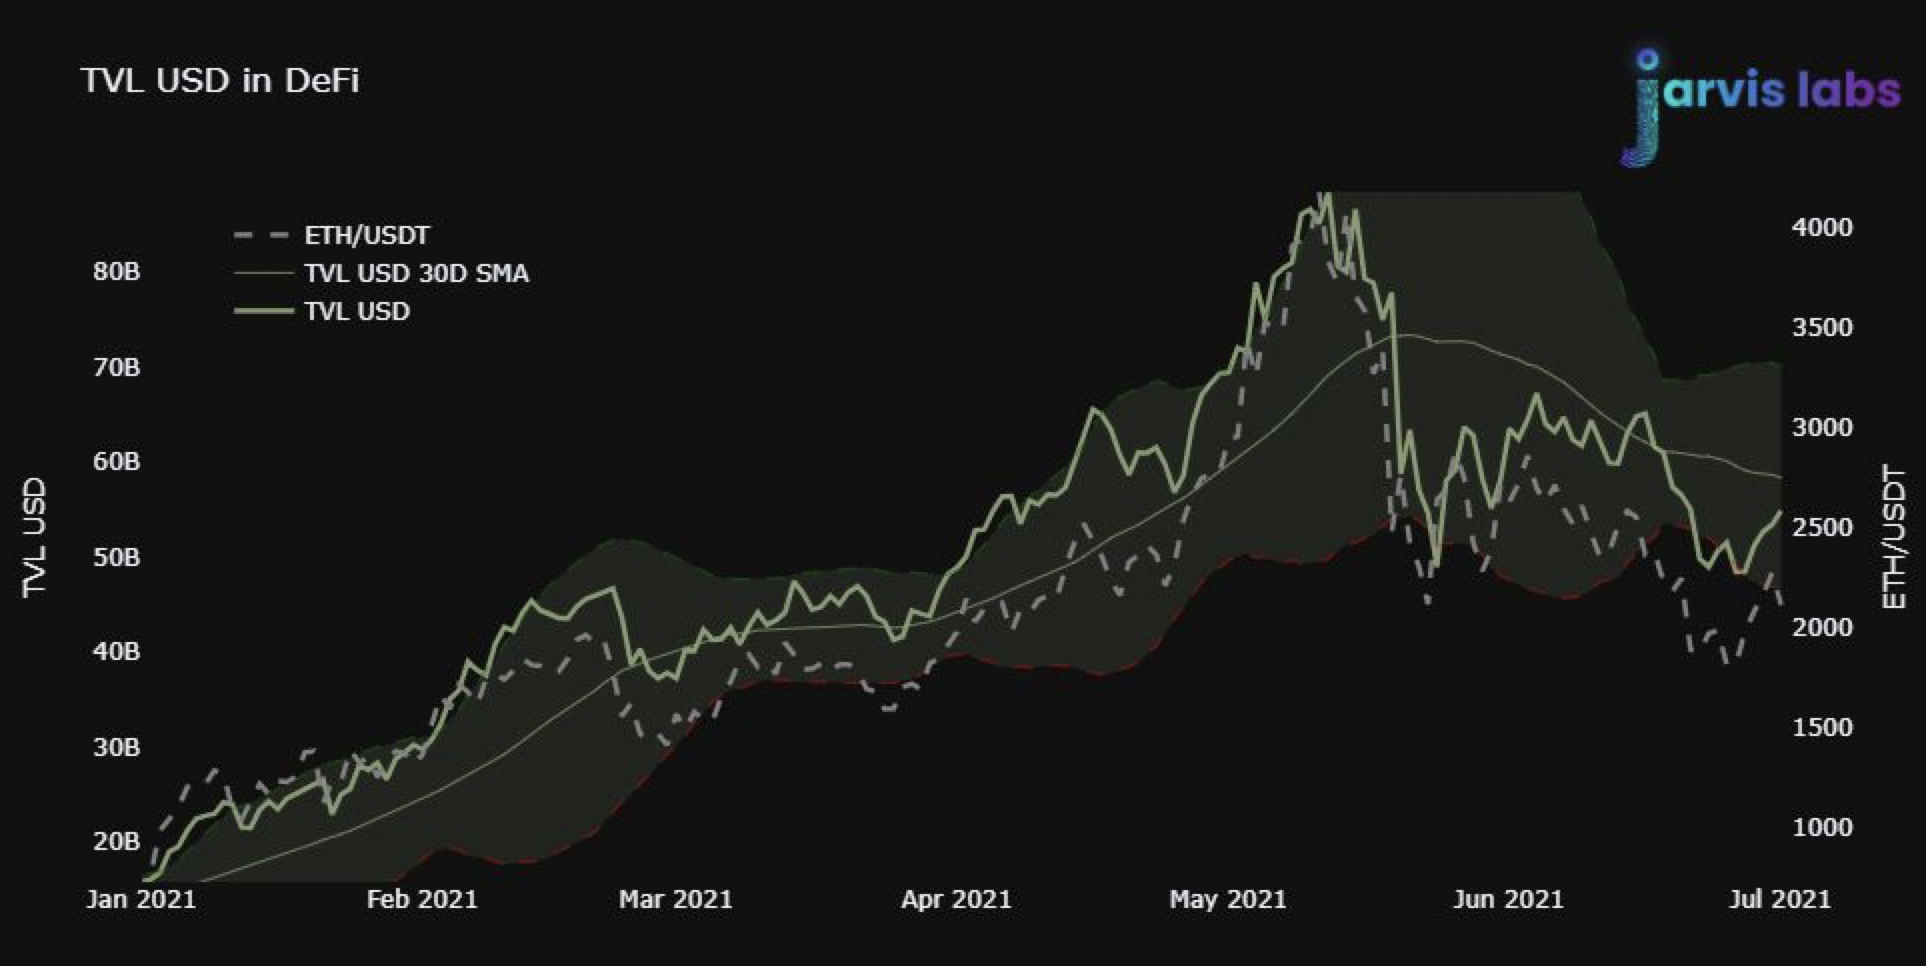
In a similar vein, we are looking at trend analysis of locked supply.
The chart below is total value locked (TVL) in terms of US dollars. This is plotted using bollinger bands to find extremes.
What’s interesting is when TVL pushes the bands at the extremes we see mean reversion taking place. This is intuitively makes sense, but has never been done for value being locked.
Also, there is a bit of a momentum indicator there. When TVL trends above the thirty day average TVL, price has strength.
Now, these two measures are merely preliminary analysis. There should not be anything used here for your own trading, yet.
What we are doing is seeing how these ratios hold historically as well as with various market caps and project age. The idea here is to scale these metrics, ratios, and models to as many tokens as we can.
Then eventually let the AI run with it…
Its an exciting new branch of analysis we are developing and you will be sure to see more in the coming weeks.
And the reason I show you these charts is to prepare you for what’s to come in a few days. Something I alluded to earlier.
In the meantime…
Market Update
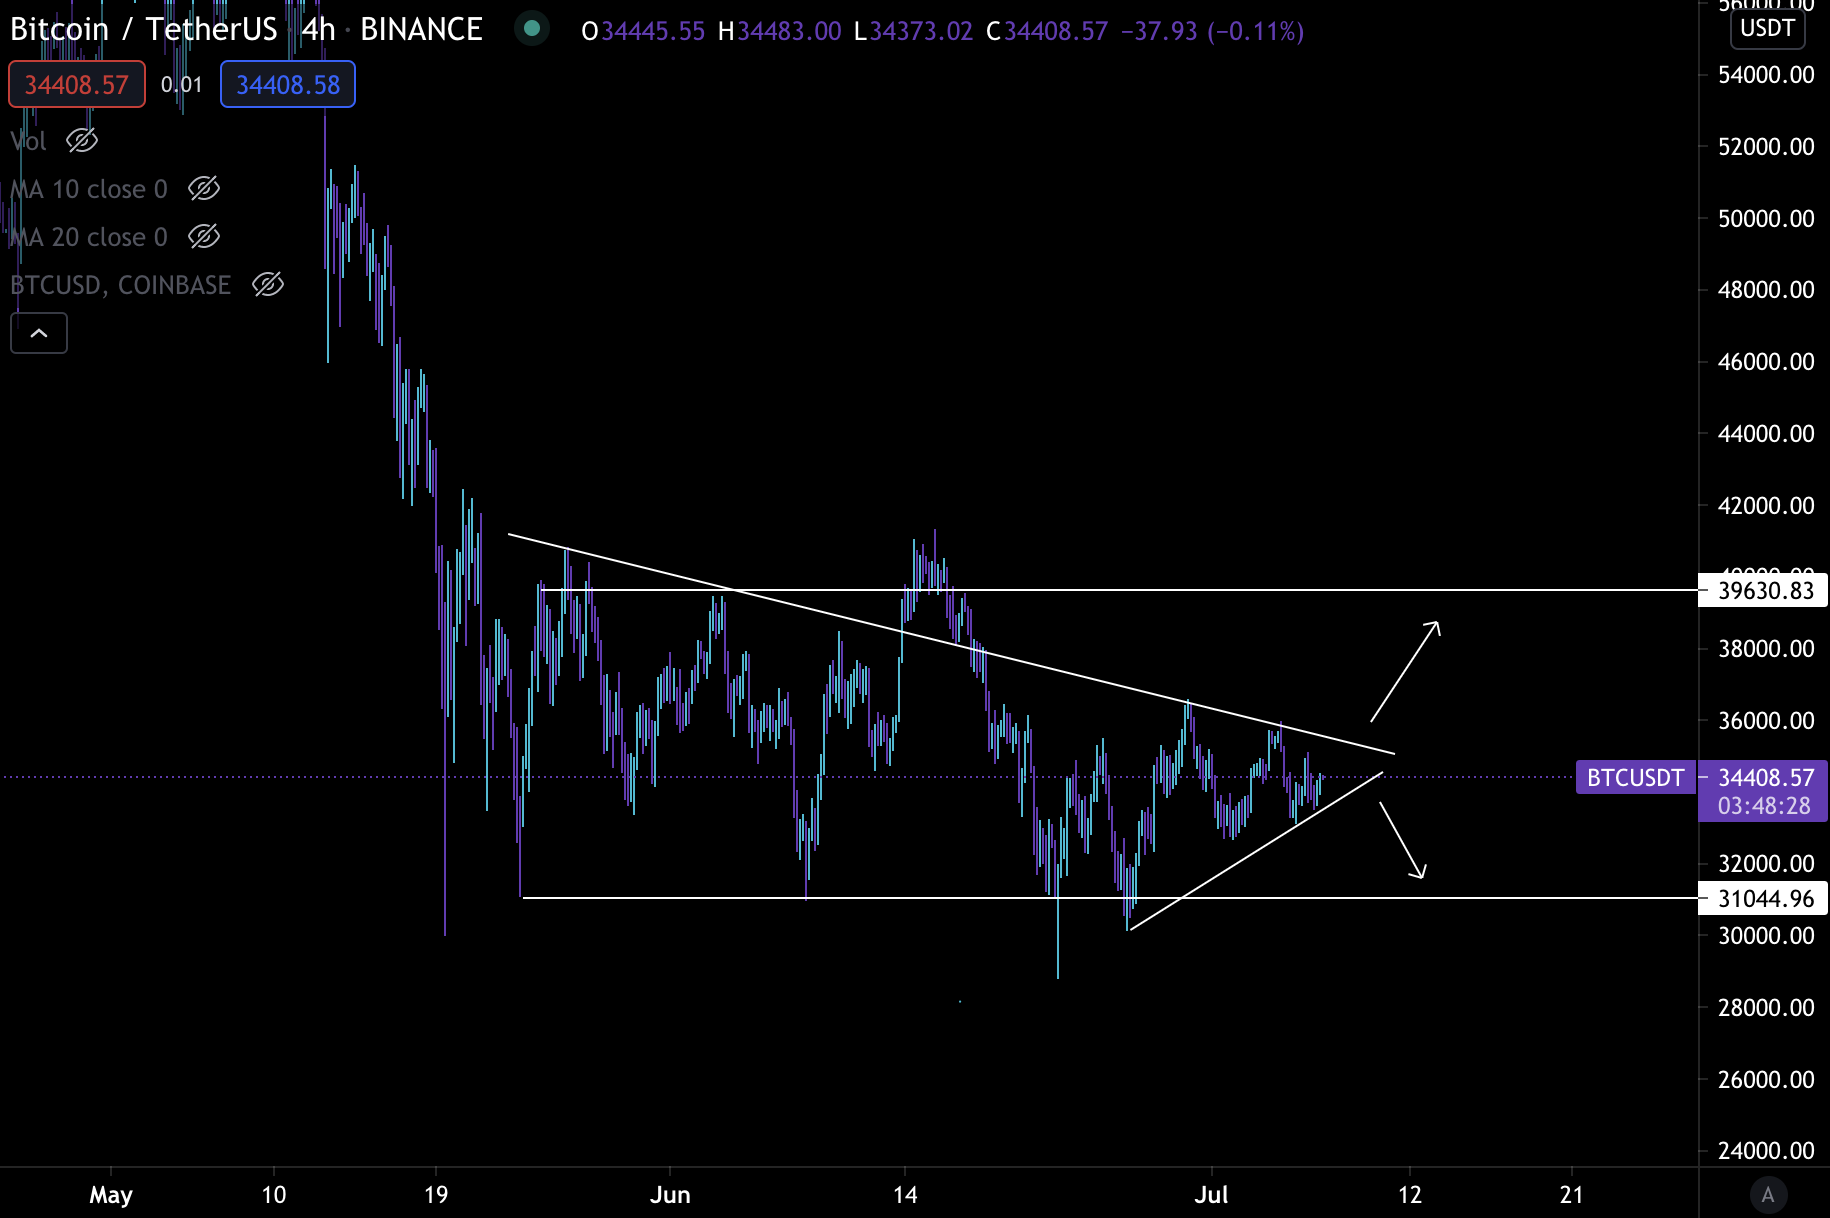
The price action is consolidating to a point where price must pop in one direction or the other.
While we wouldn’t be entirely surprised to see price run higher, we are leaning towards downside movements in the near term. Which means even if price does pop higher, we expect price will lack momentum and ultimately retest $32-30k support.
The reasoning here is some onchain activity did pop up this week. The alerts we saw were bearish.
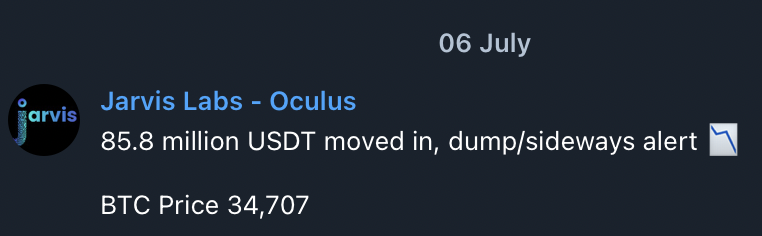
Bearish alerts might be depressing news to many, but let’s not consider it so. Instead, consider it like renewed activity in the market.
Any activity right now is good activity. That’s because for price to break up and out of this current range, it likely requires capitulation of this current range.
So if we start to see whales beginning to position themselves for downwards action alongside stablecoin inflows, this is good. It means bitcoin is turning attractive again.
In terms of what whales are doing now, we can use a chart from Material Indicators for some clues. The bottom half of the picture shows whales (brown and purple lines) are market selling. Those are the two colored lines we really care about.
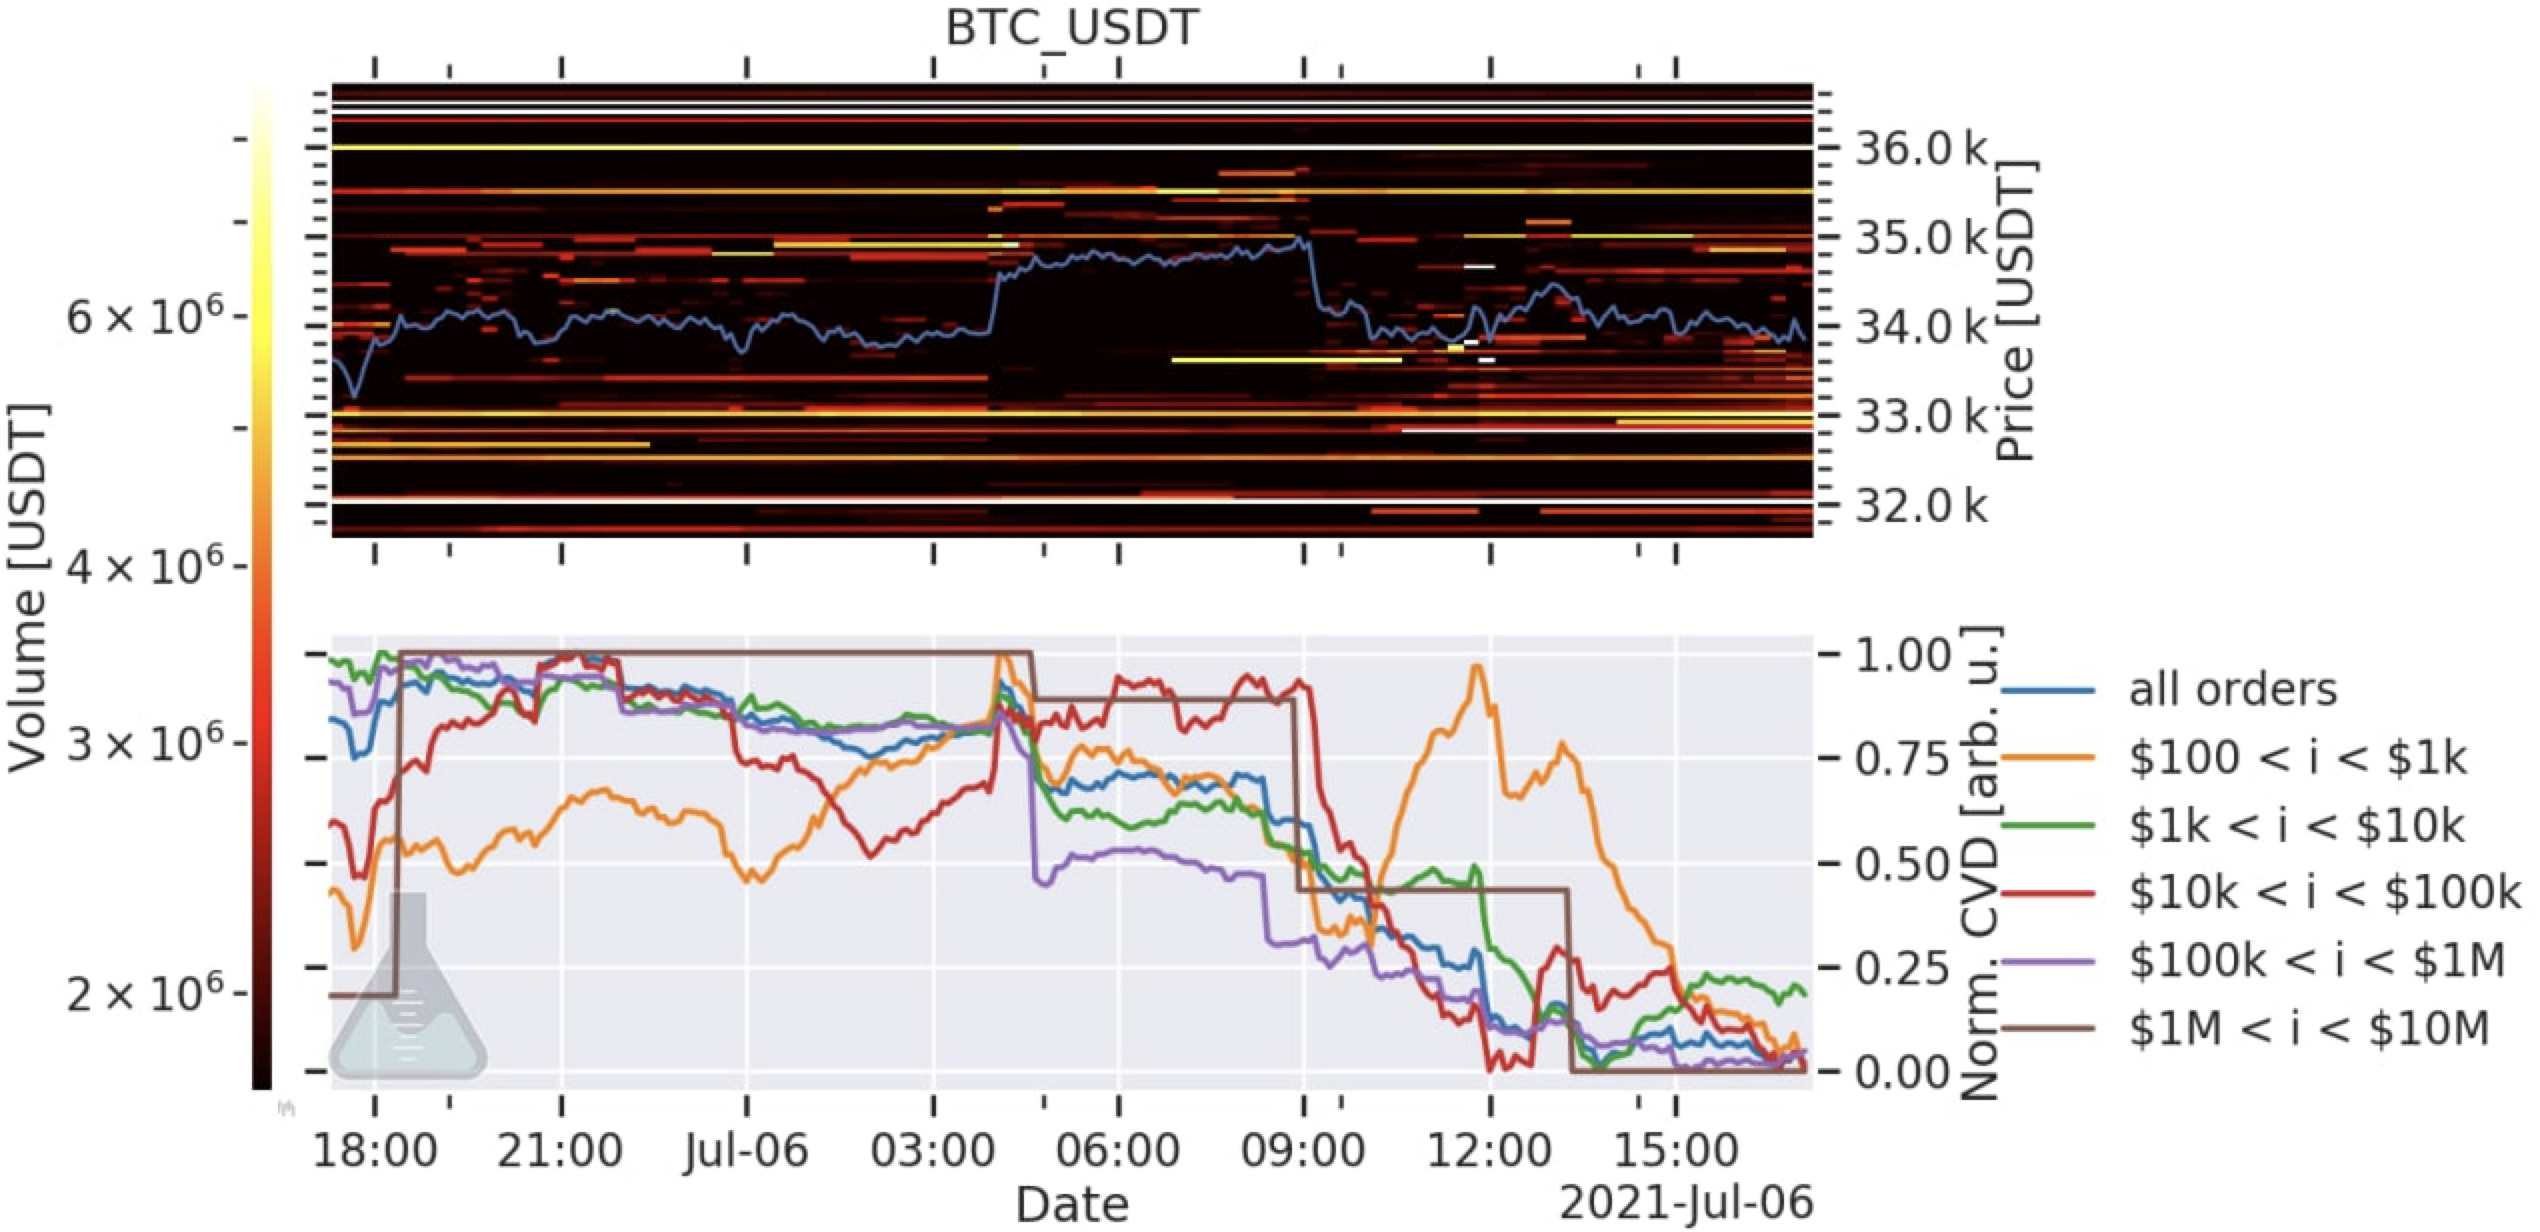
Whatever brown and purple are doing tends to help determine a trend. ETH shows something similar for whales.
Macro indicators are also showing some headwinds for bitcoin.
The 30yr yield chart has shown high correlation with bitcoin of late. Movements can lag 24-48hrs between the two, but with the 30yr yield dropping below 2%, we should be aware.
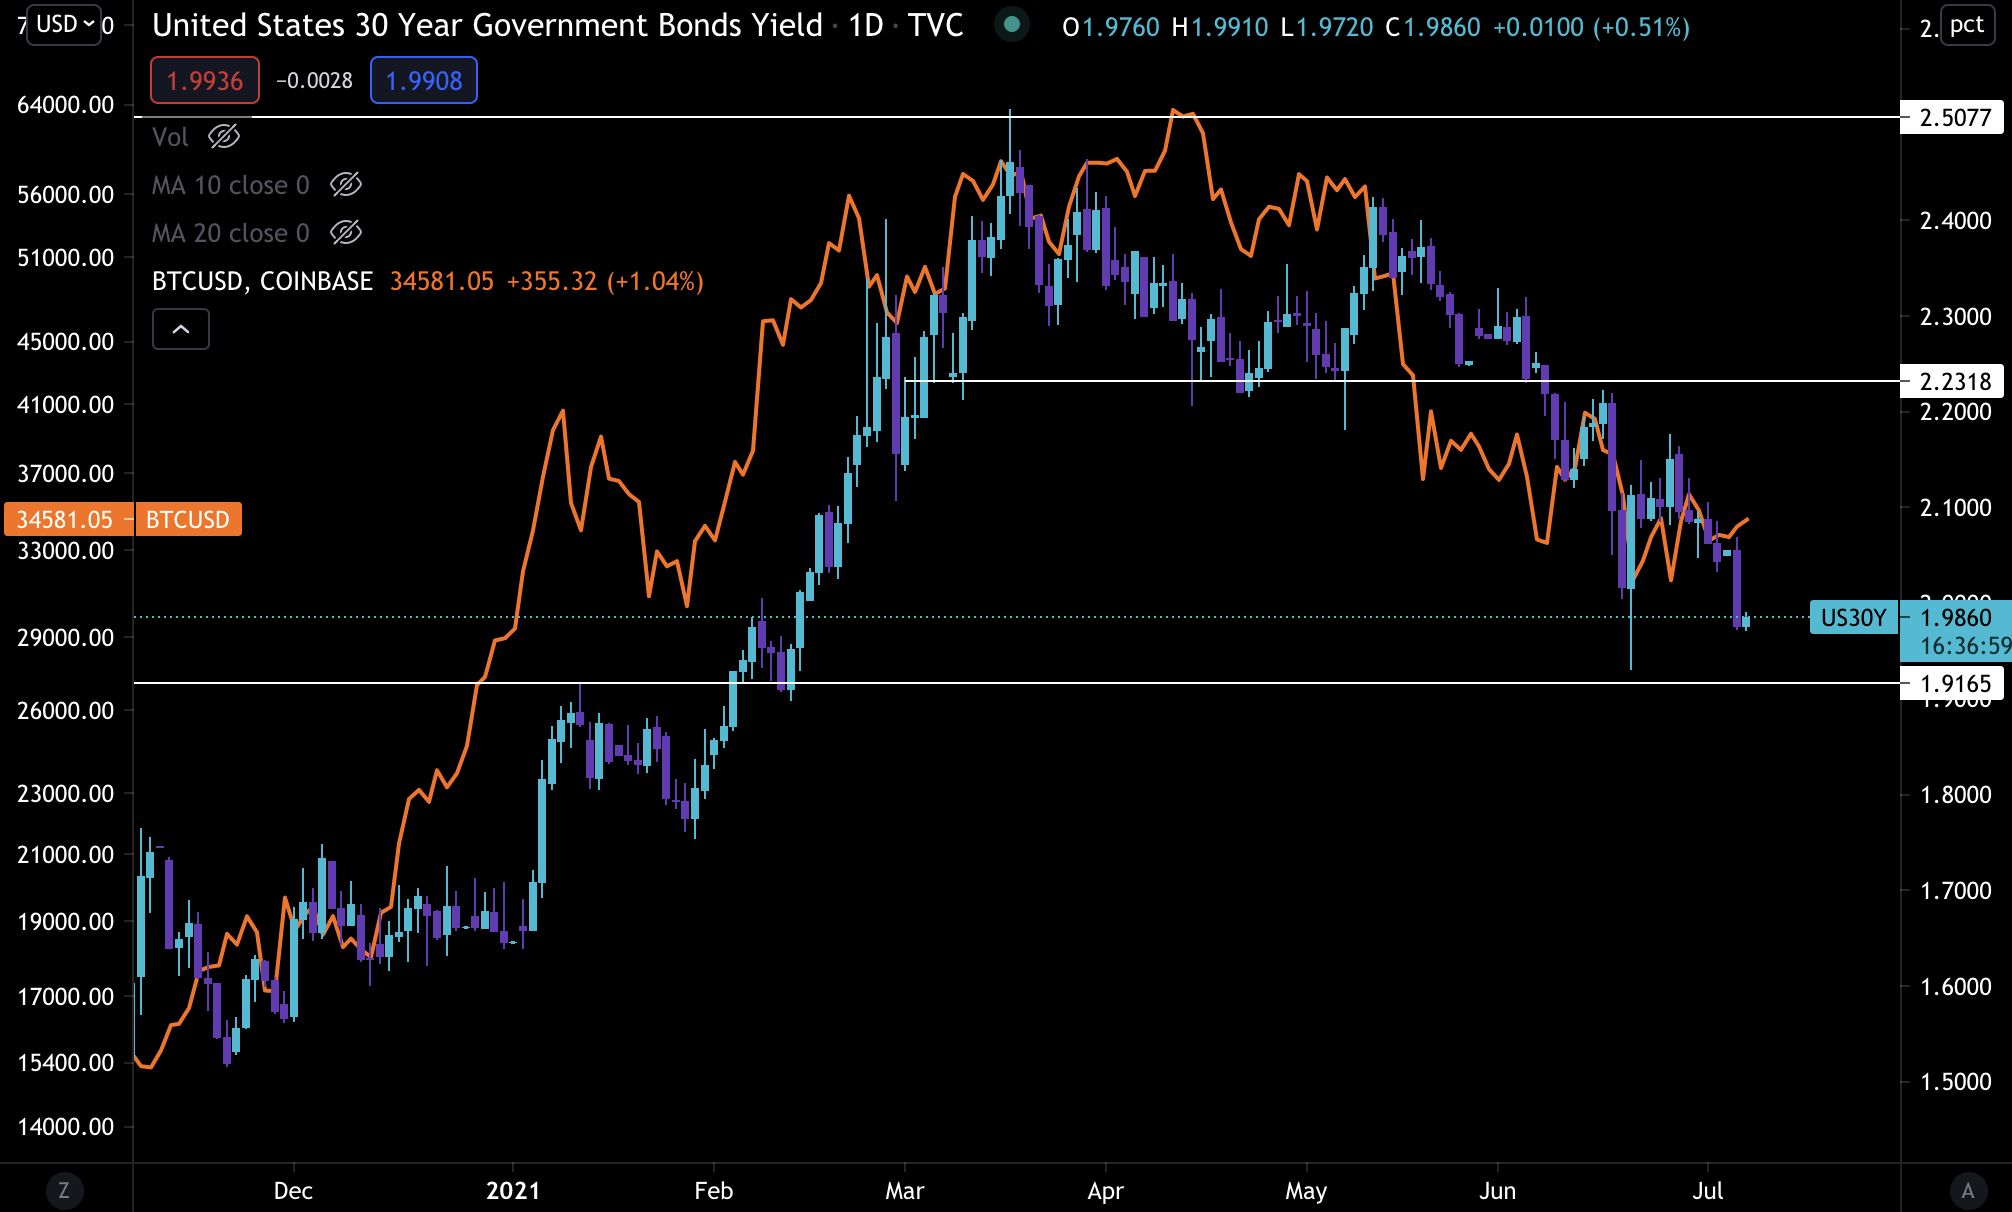
Then when we pair this up with a DXY (US dollar index) that is trying to break resistance and run higher…
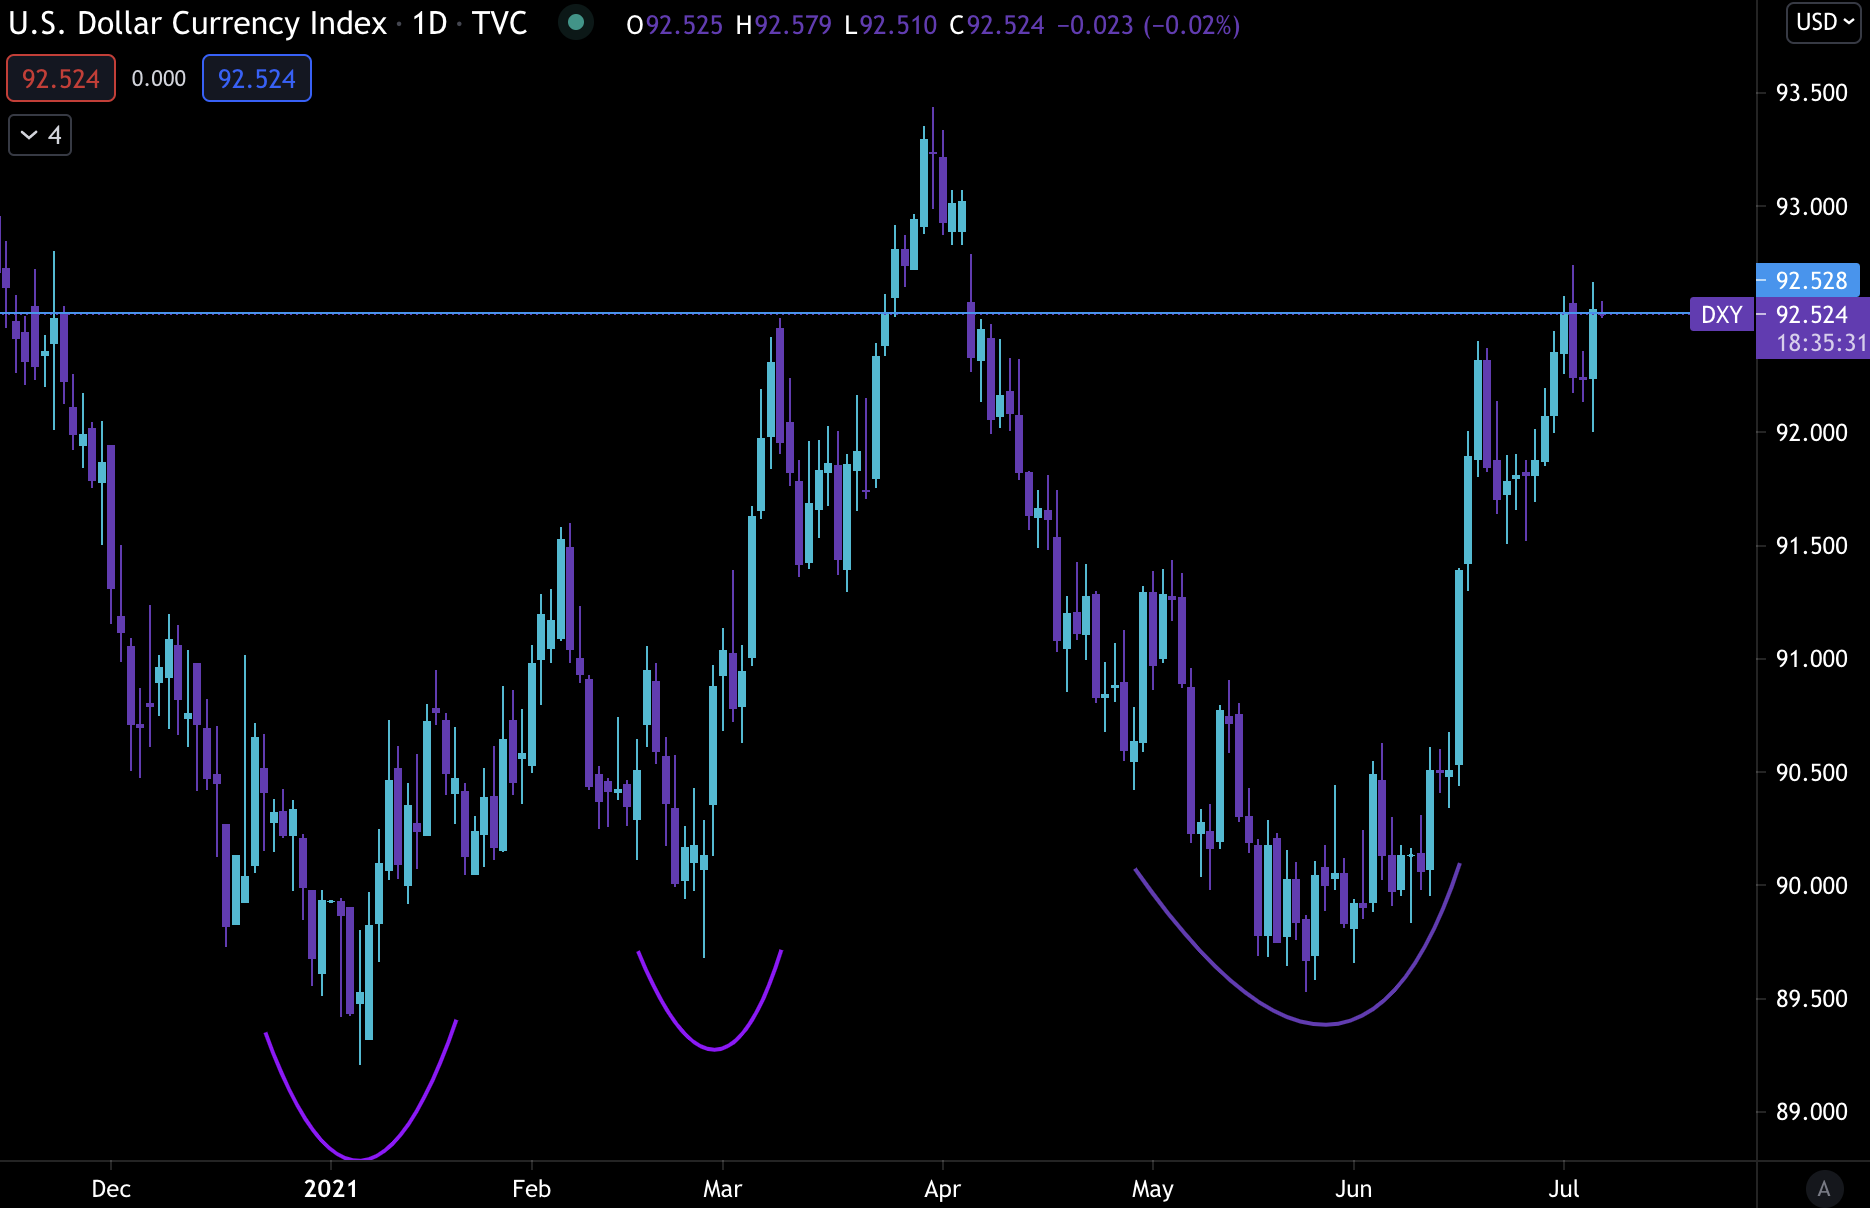
We seem to see a few macro signals that are likely to impede bitcoin’s price over the coming week.
I hate to try and predict such moves, but this is a scenario where a market mover like Pablo might try and take advantage.
If DXY moves fast and bitcoin breaks to the downside, this is when trying to break a support makes sense. We have tested the $32-30k range five times prior with sizable wicks.
When I see price action like that I always think of it like piercing holes into a floor. Once there are enough holes in the floor, the ground becomes unstable. And another retest means the chances it holds are lower.
I think the next few days will be pretty telling. We’ll see how it pans out.
Your Pulse on Crypto,
Ben Lilly


