Purging Irrationality in Crypto
Technical Tuesday Update

We got some activity.
The Monday open brought with it a strong recovery for bitcoin. Its price rose as much as 11.5% on the day.
We’ve witnessed this type of price action before.
It tends to happen in recent bottoms. In the chart below I used white arrows to point out those prior instances.
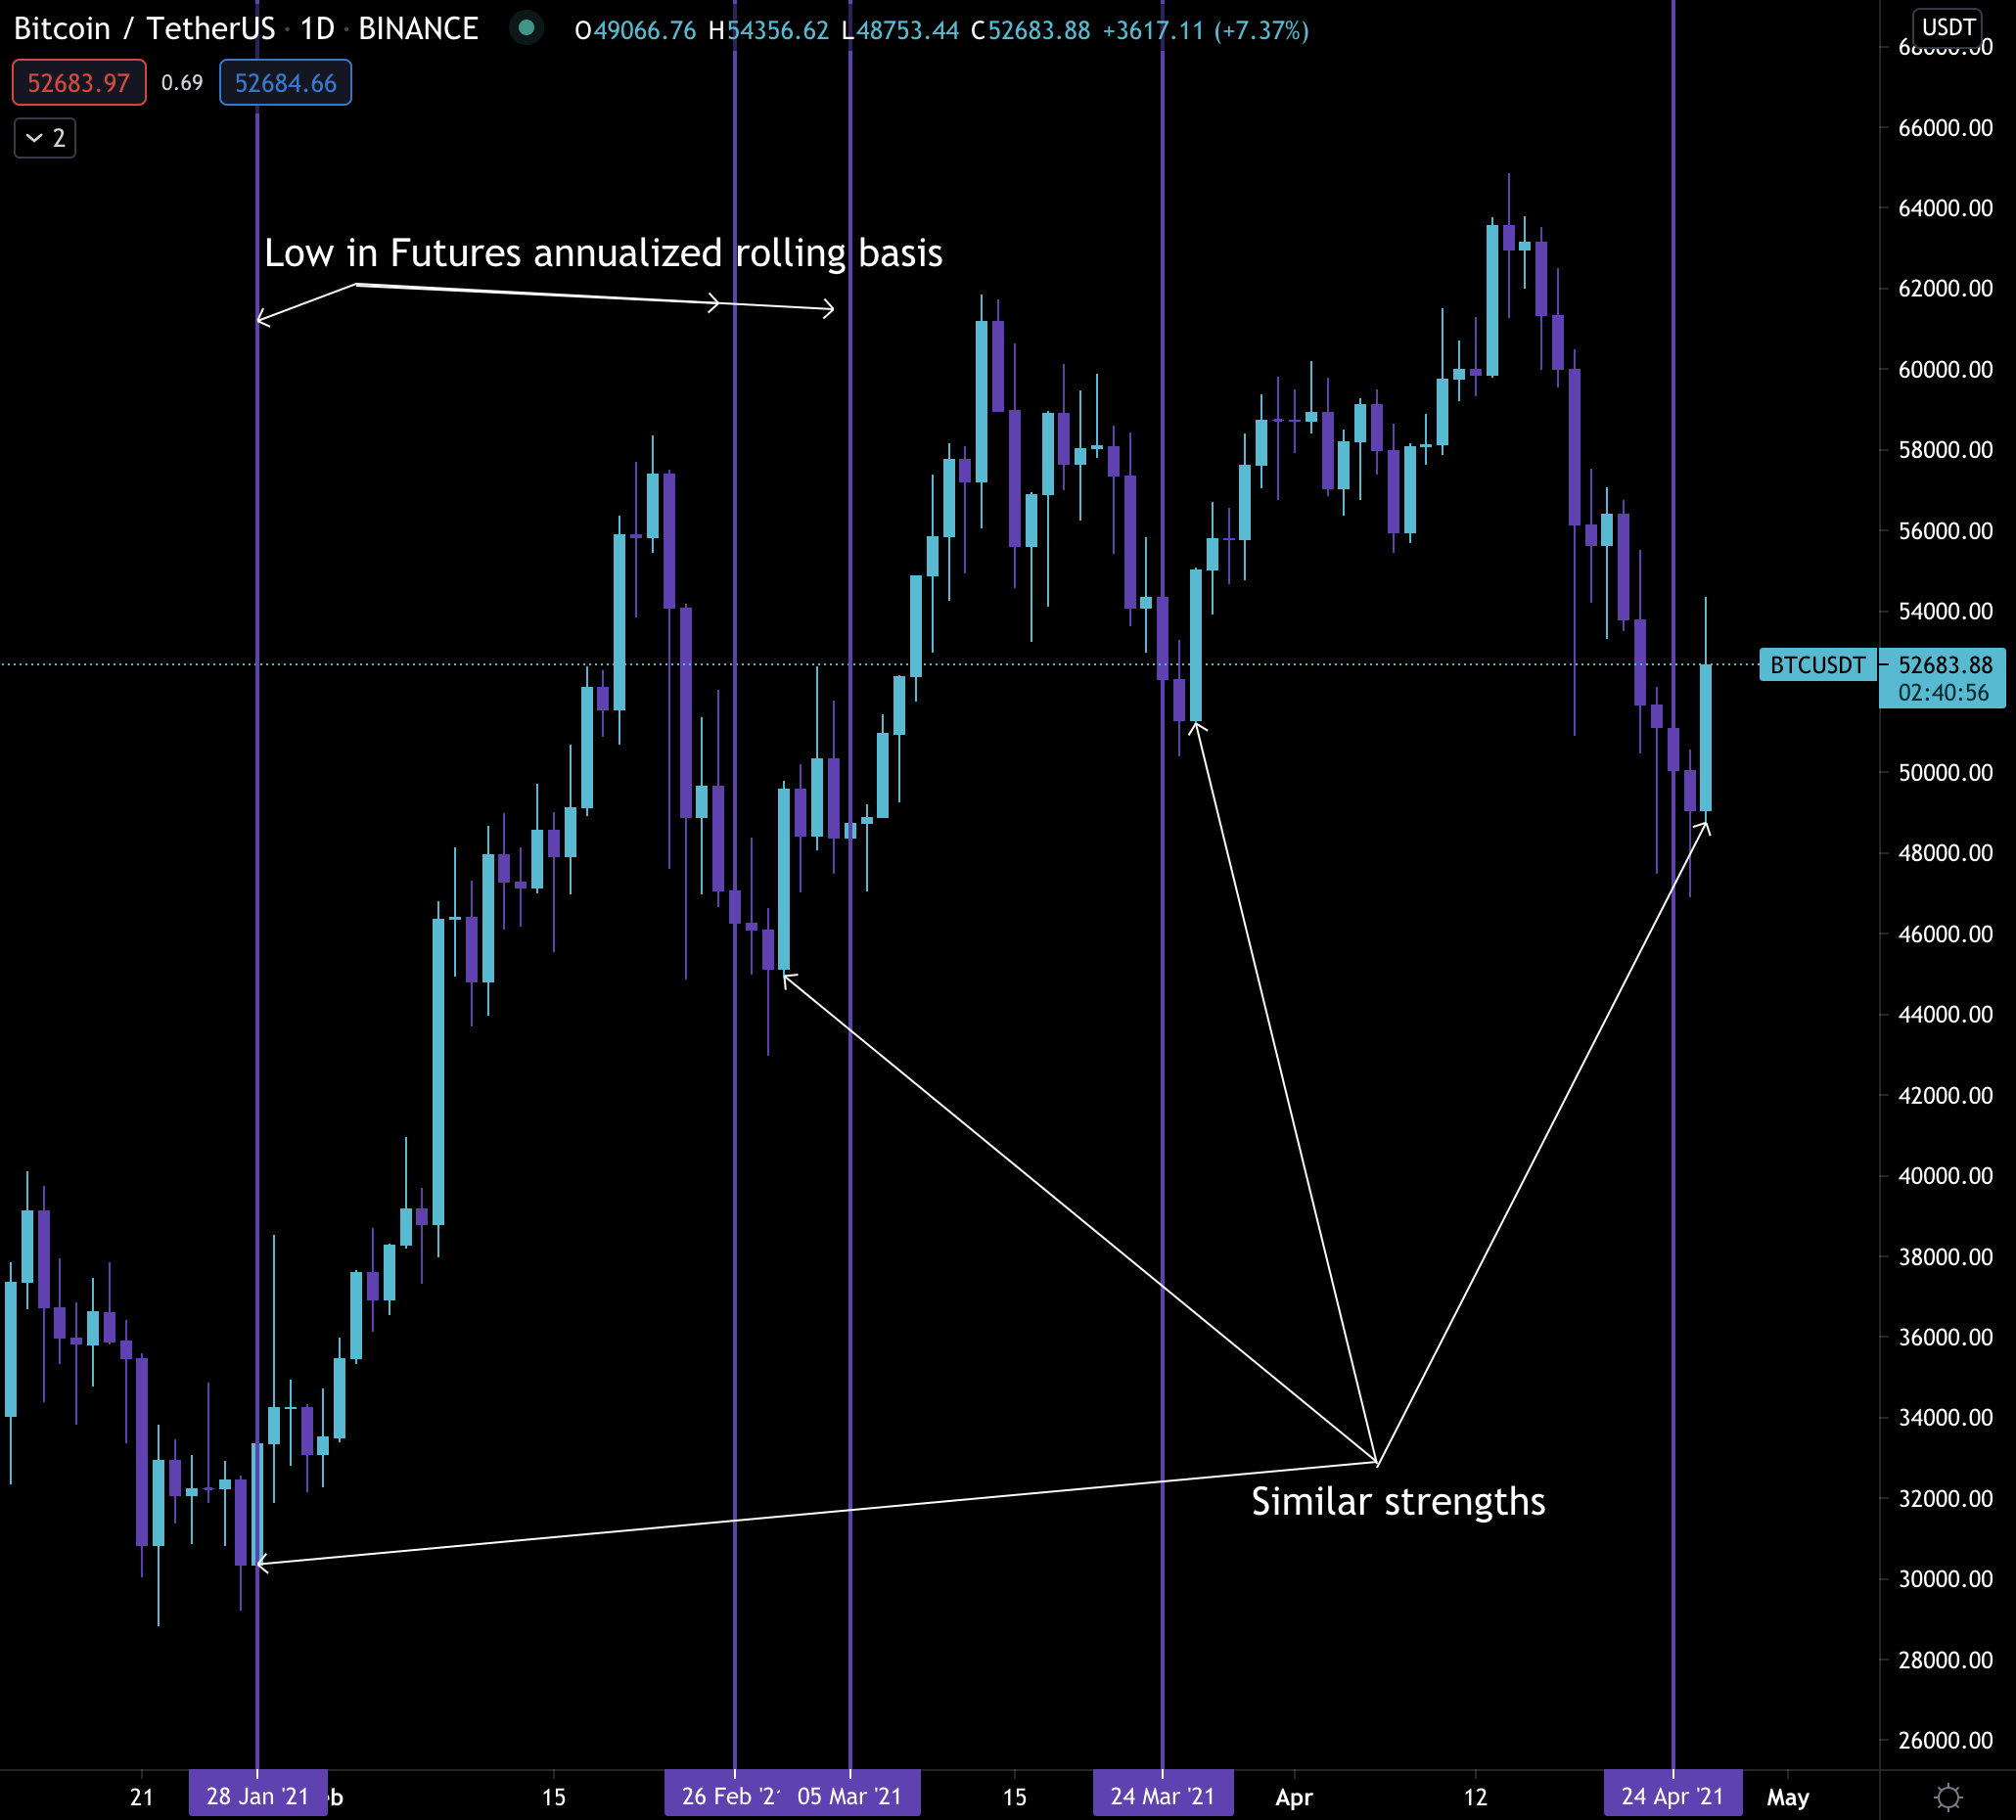
What’s interesting here is how bottoms tend to play out during this rally. Each time prior to a price reversal, the premium on futures one month out were trading approximately 6-7% more than spot prices.
That’s what the purple vertical lines represent - the lows in bitcoin futures annualized one month rolling basis. I know it’s a mouthful.
But the reason I bring this measure up is because it signals how much the market believes bitcoin’s price will be one month from now. The lower the basis, the more bearish the pricing.
I like to view it as a way to measure how much FOMO is in the market.
Nice buy the dip indicator for a bull market. Let's see if it continues.
— Ben Lilly (@MrBenLilly) 3:02 PM ∙ Apr 23, 2021
Pablo selling, Grayscale beginning to see inflow, waiting for coinbase outflows... Next week feels like a make or break.
The way you can view it is simple. When everybody thinks bitcoin is down for the count, it reverses.
Yesterday was case in point of that reversal.
What’s better, the funding rates are neutral. In fact, I’m still seeing some negative funding rates pop up occasionally. Here’s FTX over the last few months.
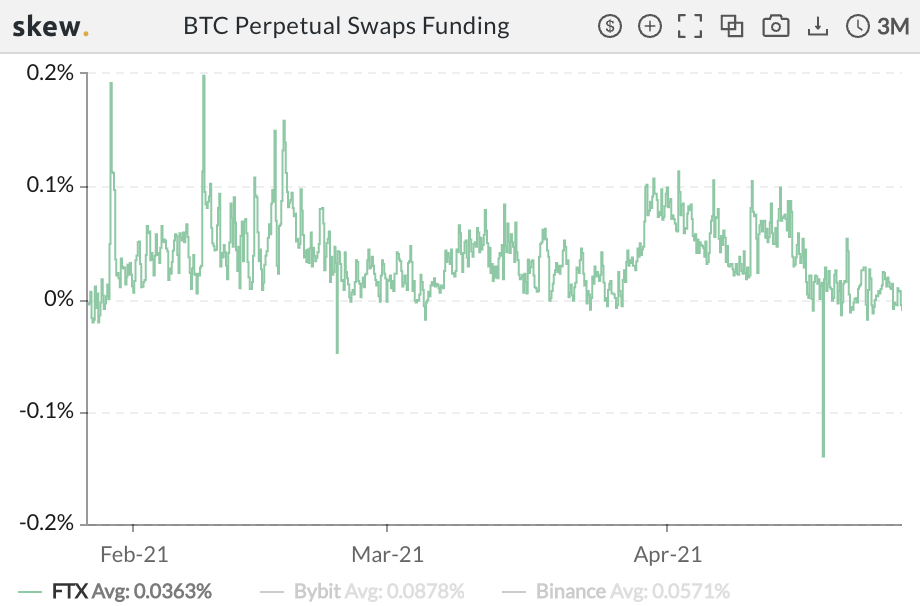
If you look at the chart you can see the last time we were at similar lows was March 26th.
And looking at a price chart, you’ll realize that date is the last time we saw bitcoin reverse with strength at a local bottom.
Lots of similarities. And it’s the type of familiarity we enjoy.
That’s because for bitcoin to generate enough momentum to pull itself out of these lows, we want low funding rates. We don’t want irrationality to quickly resume as if a drop never happen. Thankfully, as I write this issue of Espresso, not a single altcoin shows a funding rate more than 0.051%.
It’s a reset. Exuberance and irrationality have been purged for the time being.
To decide whether bitcoin is building momentum let’s check out on-chain activity…
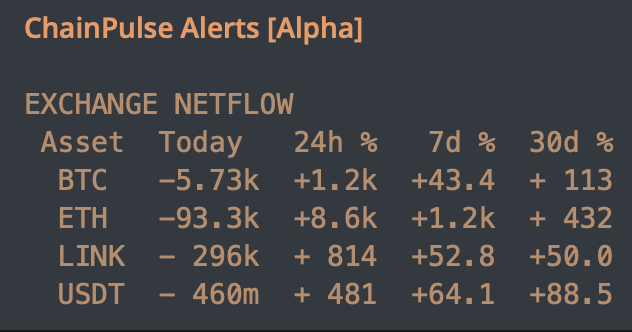
The netflows from two days ago helped set up yesterday’s strong price action. Both bitcoin and Ethereum posted negative flows. Meaning more BTC and ETH were leaving exchanges than entering. This is a bullish scenario.
USDT was also bullish. We hadn’t seen this for some time.
Yesterday the flows were similar except for USDT. You can see them below.
The strong price action was a good start. Funding rates are allowing for a rally. And netflows are turning bullish.
This is a good start. I still want to see better transactions, exchange flows, and market movers. We’ll need these in order to cross the current bearish / bullish divide at $55k.
You can see it in the chart below that Benjamin whipped out as he hopped online for about 20 minutes yesterday to provide an update to clients.
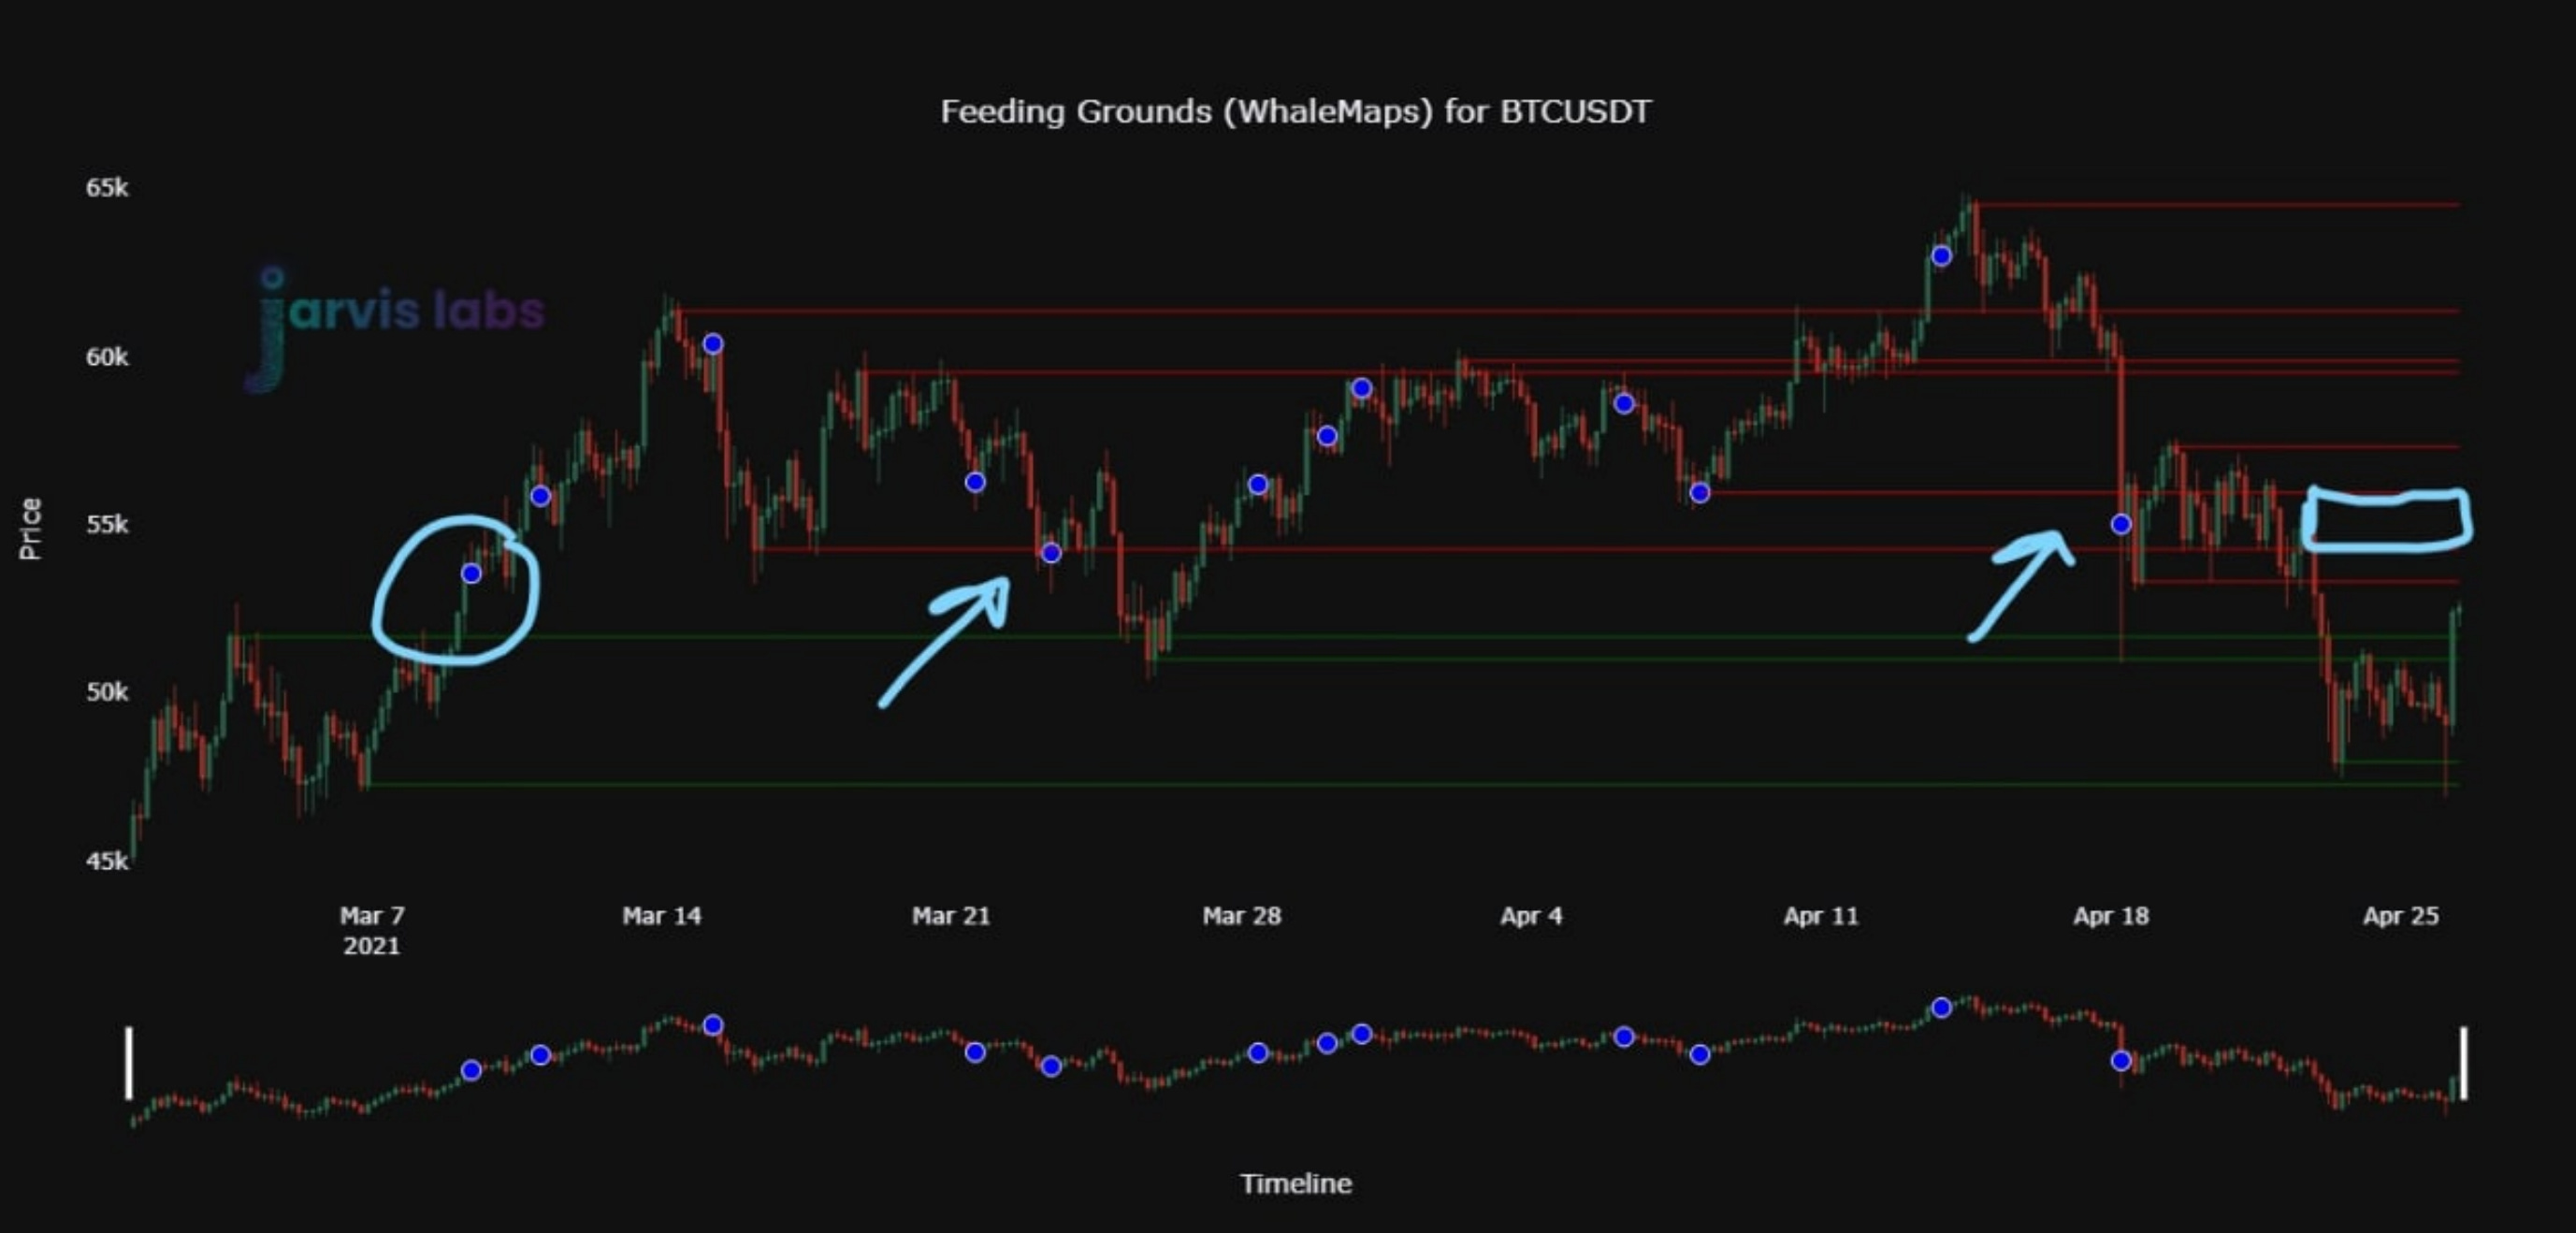
The blue dots are whale transactions. The red and green horizontal lines and resistances and supports. The boxed area is a feeding ground whales have defended several times before.
The defended area which served as support is now resistance. It’s the most immediate hurdle bitcoin faces.
That’s your update for today.
Tomorrow we will take a look at Gamma in the options market. Weekly options expire every Friday at 8:00 UTC. In the 24-36 hours prior price can be impacted by the upcoming close.
Luckily for us we can determine if volatility is teeing up to be higher or lower depending on how our Gamma model looks.
If we combine the Gamma model with netflows, we have an edge in the market.
Your Pulse on Crypto,
B
P.S. - Elon?
@elonmusk ?
— Ben Lilly (@MrBenLilly) 2:32 AM ∙ Apr 27, 2021


