Price Tends to Rise After This
When a major wave recedes, it's time to buy

I like to think of it as trying to stuff five liters of manure into a 2 liter bag. There’s more than the bag can handle… Which means shit goes everywhere.
To date, there’s only been a handful of these moments in bitcoin when looking back to 2017 through the lens of one on-chain metric.
Two of these moments you can probably rattle off.
One was the November 2018 selloff, which was like price walking over a cliff to sub $4k levels.
Another was March 2020, better known as Black Thursday.
A third happened back in 2017 during the well known accumulation cylinder of phase that tends to precede a parabolic rise. A pattern made famous by Jesse Livermore from the early stock market days.
The most recent one was last month. And what I’ll show is the previous three times before resulted in ideal buying opportunities for long-term investors.
The metric we’re looking at today is simply the inflow of bitcoin with a seven day rolling average.
You can see the indicator in the bottom quarter of the chart below…
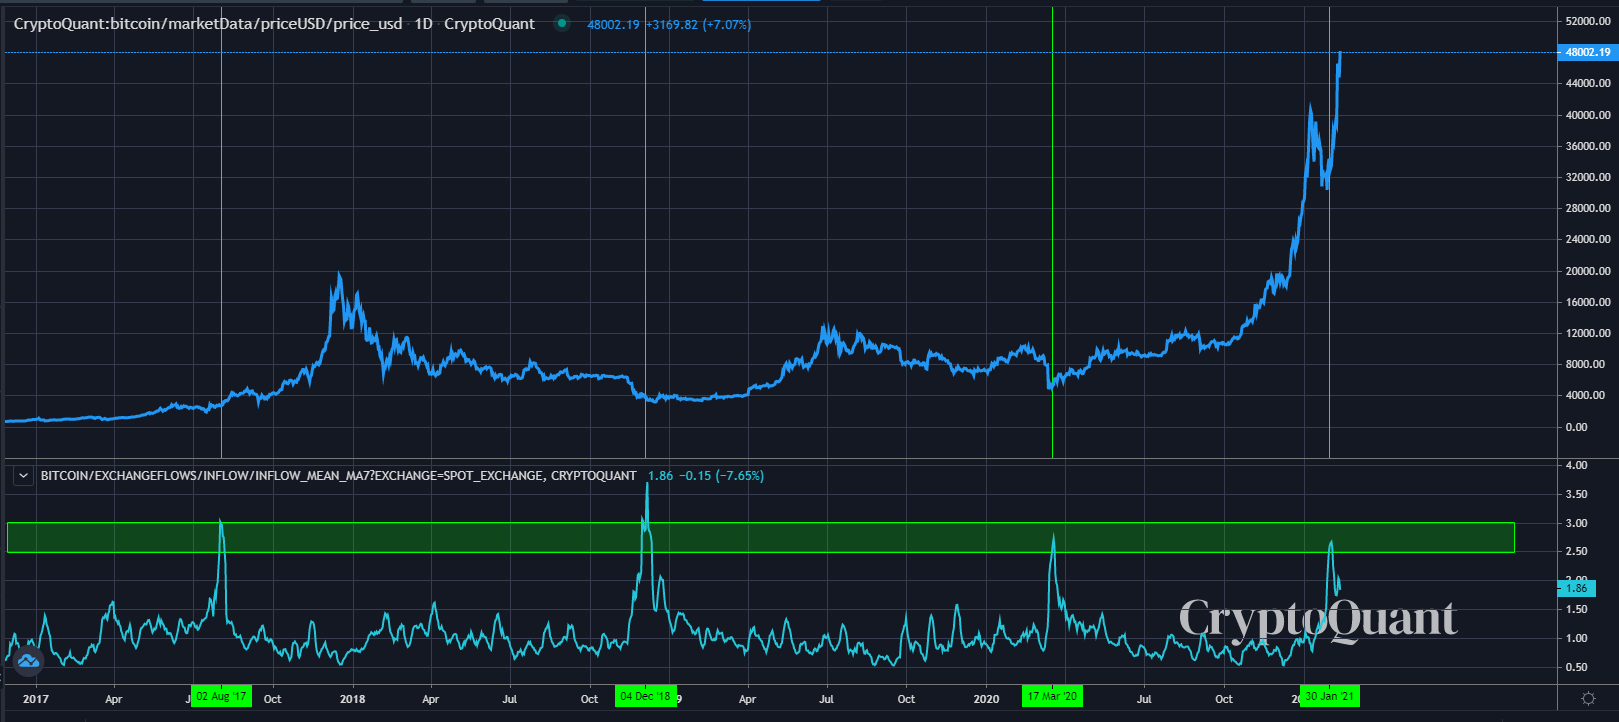
The green area is best referred to as the shakeout zone. This is where the amount of bitcoin being sold in the market is reaching an extreme. Or said in light of the opening line, the market can support 2 BTC, yet traders are dumping 5 BTC…
It’s a sign of overselling and it’s when traders and investors tend to get shaken out of the market.
Historically, this has been a great indicator for market cycles.
While there could be a higher reading to come for the inflow indicator, it still shows it’s reliable based upon the price action after the most recent horizontal line.
What’s more… you combine this during times when the GBTC premium is at or near 0% and it’s an ideal time to build a position. That’s because the premium rarely drops below 0%, and in times of euphoria, you can get one way leverage on BTC’s price… upside leverage.
While these spikes are rare, when they happen, you seize it.
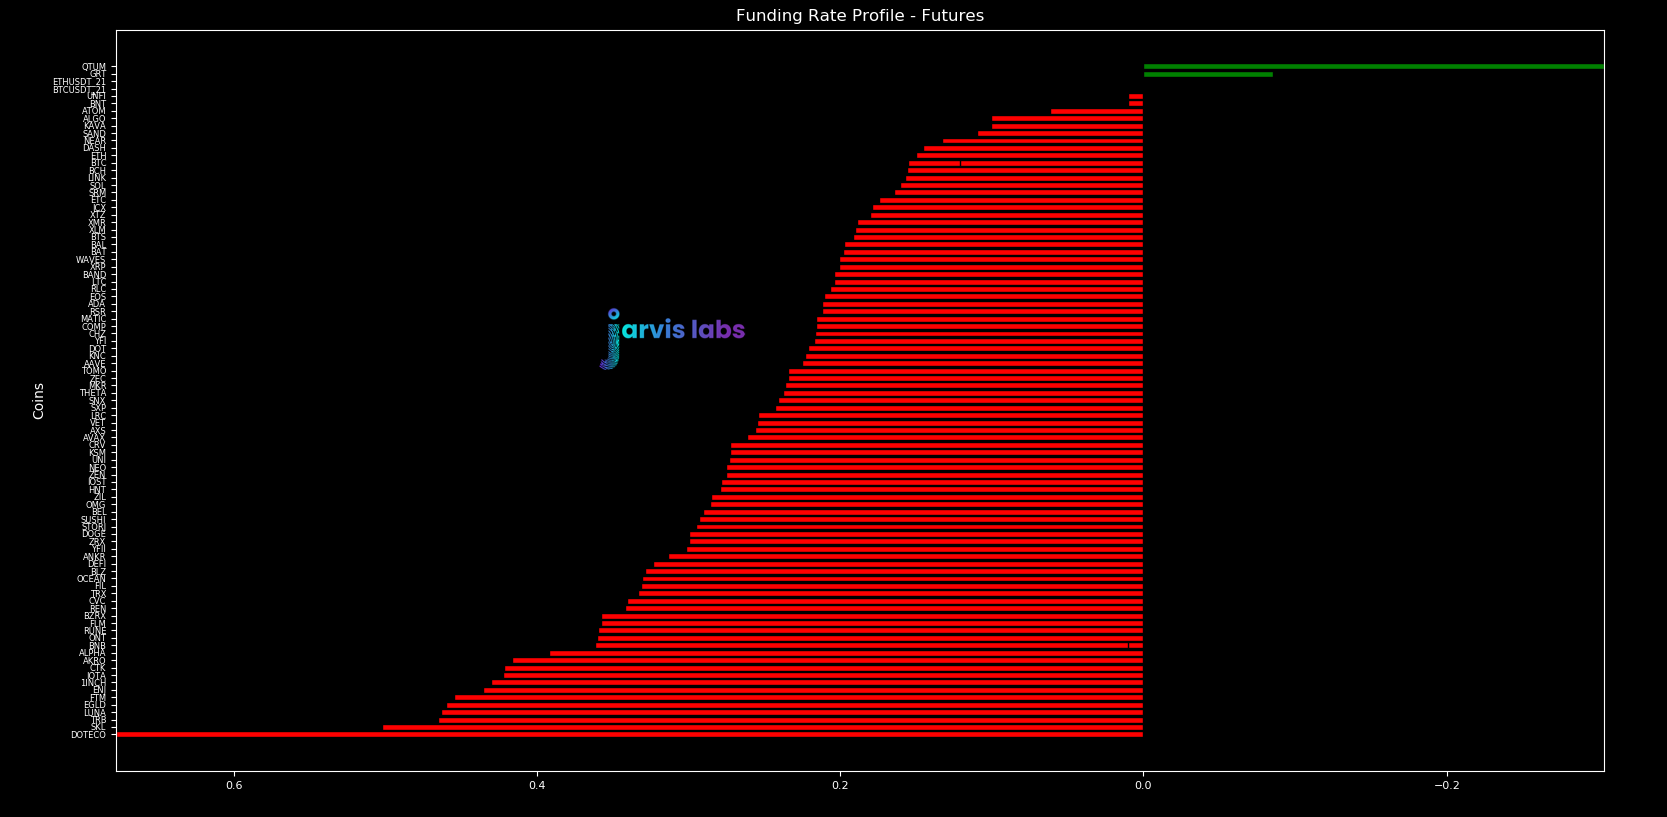
Now, a quick update on the crazy derivative traders trying to pay short side traders over 700% on an annual basis (referencing ALPHA’s 0.67% funding rate yesterday of 0.7%)
It’s still insane…
And here’s the funding rates on a historical context… still insane.
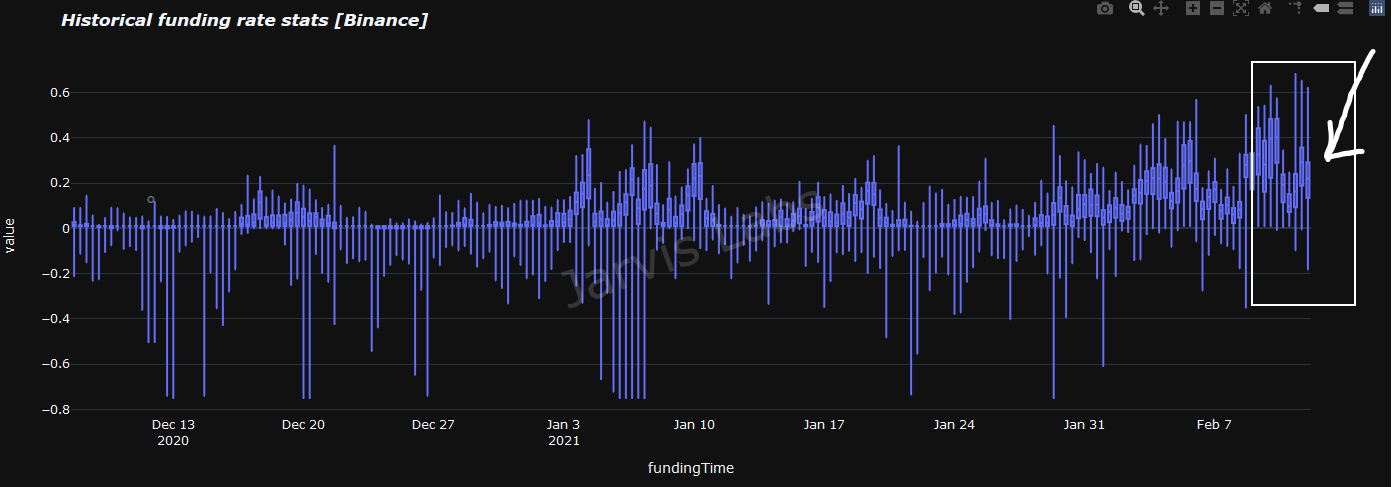
Hopefully in the next few days we can get a reset. If we get it, consider it an entry point.
Enjoy the weekend!
Your pulse on crypto,
B
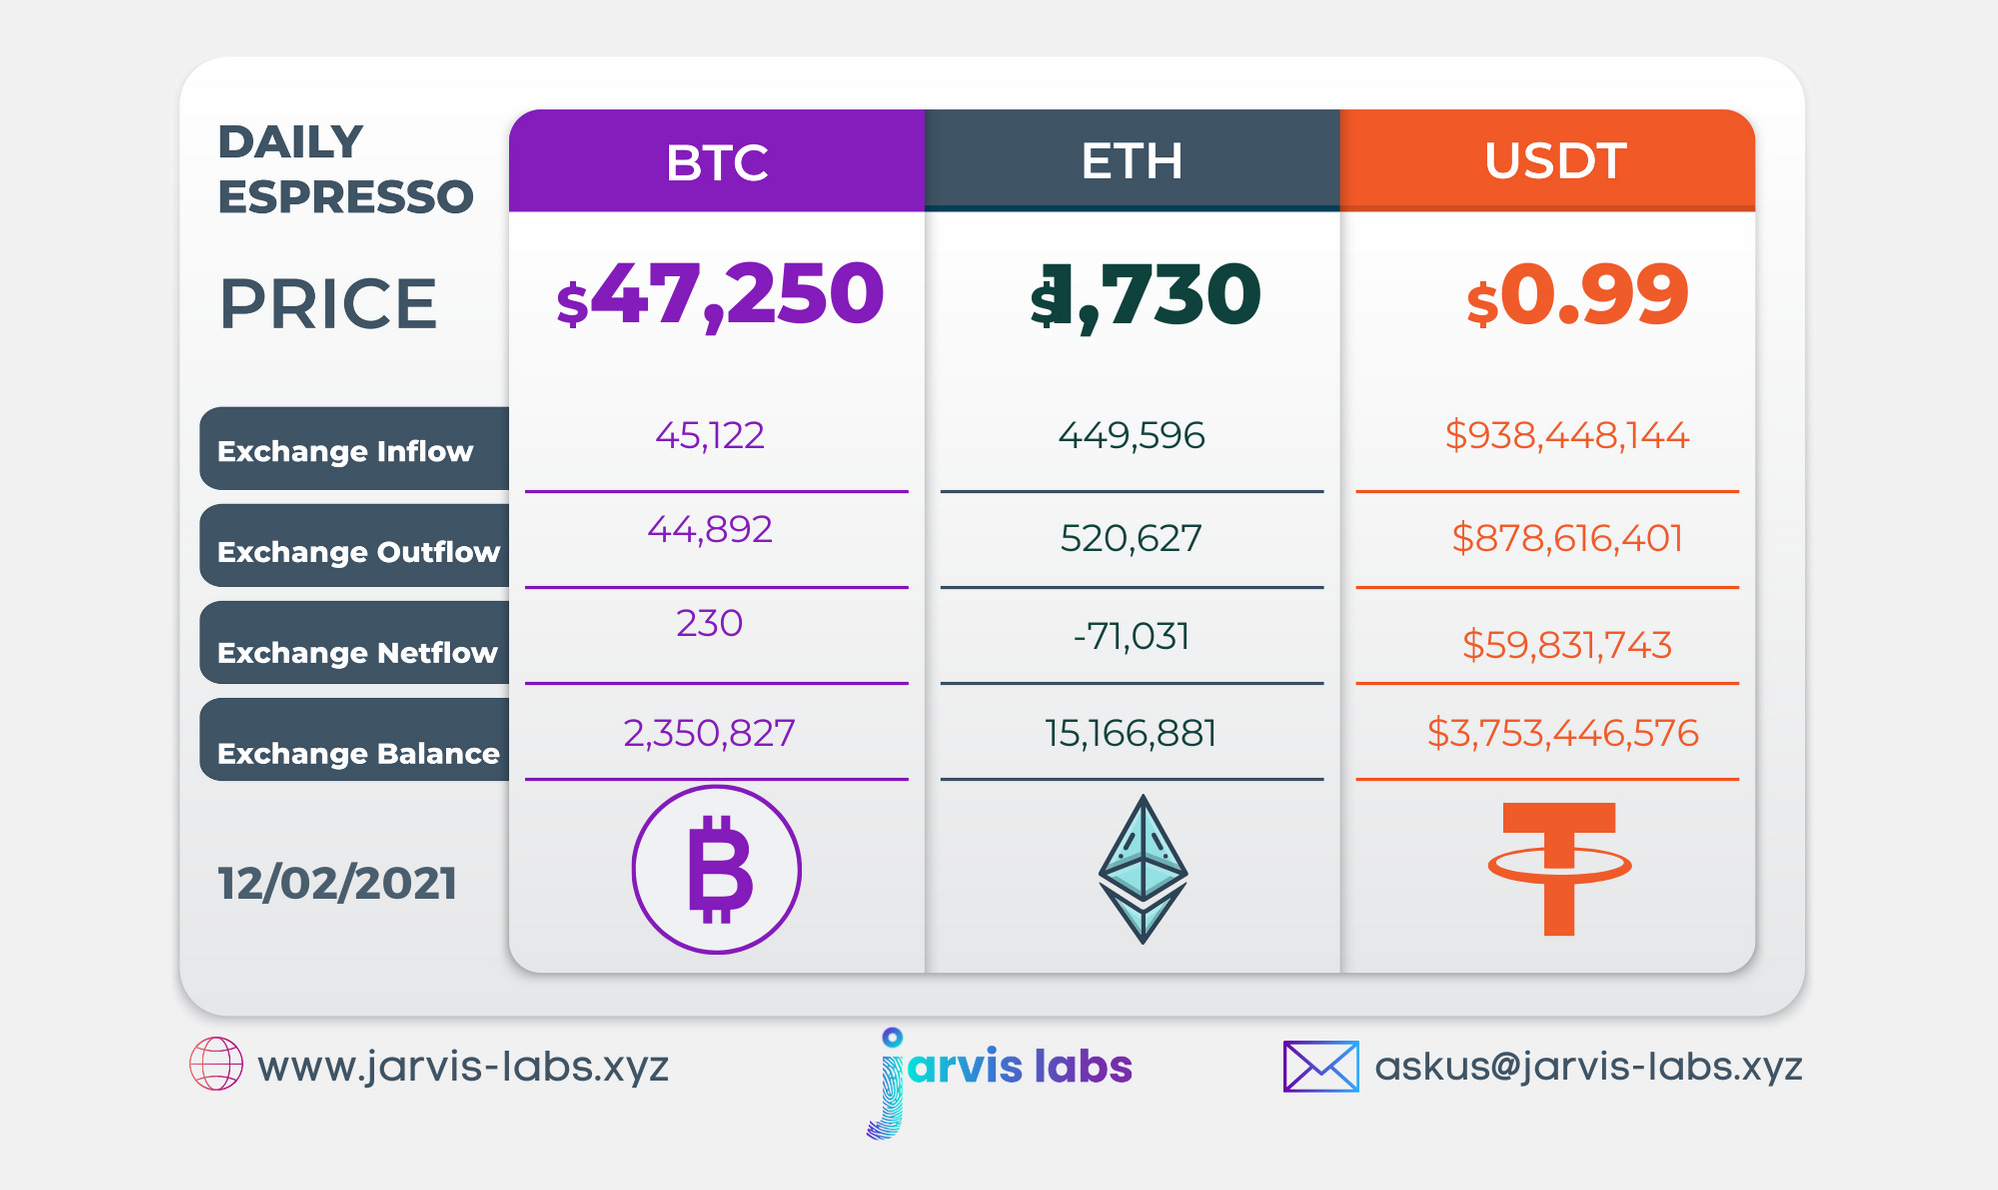
Below is our daily exchange flow data. This is a great gauge for understanding if BTC, ETH and USDT are flowing into exchange or leaving. If BTC and ETH are entering exchanges it can generally be viewed as bearish. The opposite scenario is bullish.
When USDT is flowing into exchanges it’s typically viewed as bullish. The opposite scenario is bearish.
This should only be used as a general gauge. Tagging the exact wallets these flows move into or out of helps improve the reliability of this data, which is what we do at Jarvis Labs. To date we have over 800 market mover wallets and 16 million wallets tagged all together. Consider us your on-chain trackers.