Predictable, Controllable
How to master your emotions by looking back in time.


As I got hit in the face, a smirk appeared.
I focused on not letting it show...
Its now happened the same way, twice. Predictable. Which also means controllable.
It's why I consciously try to tame my smirk.
I force myself to be patient while I watch my opponent's confidence swell on the heels of the last punch.
I'm no boxer. But for some reason, when you play hockey growing up, locker boxing becomes your second sport. It's juvenile to say the least... But we try to keep it "safe". Nobody intentionally hurts one another.
It's perhaps why the book Fight Club resonated so well with me as a kid. Punching one another is not tolerated anywhere else in the society I grew up in.
Makes me wonder if feeling alive was frowned upon as well... It's too bad, realizing primal instincts can result in peaceful outcomes.
Ying-yang in a sense.
But you're not here to learn about bettering society, growing as humans, or locker boxing. You're here for some alpha, and hopefully some mild entertainment. So I'll get on with it...
There I was, hockey gloves on, mouth guard securely in... Facing my own linemate and close friend.
A few scuffles later, I'm ready to set up the familiar sequence. I slide to my left, twice. Lean close. And bait his right hand to attack.
This time, I take control of the predictable sequence of events.
The fight is quickly over.
For once I didn't feel stronger or more brute like than my rival... I felt smarter. Like I had matured in this often shunned primal-part of growing up. I learned to measure up an opponent, use strategy... all while being inundated with primal instincts.
I'm reminded of this childhood learning experience as the most recent price action makes many question whether or not this bull cycle is over.
And while I'll say I don't think we've experienced much of a selloff, it's clear that primal emotions wash over all of us when it comes to selloffs... Especially when we see BTC drop $10,000 in a day. It's an event that sparks FTX and LUNA flashbacks.
But the truth here... the recent price action is being predictable. Not in an overly technical way, but one that allows us to control the sequence.
It's simple. And you won't need some special proprietary indicator that you can have access to for three easy payments of $499. Just a calendar and simple setting on a chart.
Let me show you.
KISS
For anybody that has worked with me, I have one goal.
Keeping it stupid simple.
I do this to avoid the disconnect of what a metric is "saying" and the underlying theory of the metric. I feel this keeps things intuitive.
This keeps everybody's head on straight once you begin layering models, signals, and execution systems on top of the metric.
Jim Simons, founder of Renaissance Technologies (a firm who has some Espresso fans, glad to have you), I'm guessing would disagree with this mindset from what I've read. I've read things saying he doesn't necessarily need to know the why when it comes to signal, just whether or not its repeatable and predictable.
However, I think it's important to note that the stock market has been around for many, many decades. The amount of alpha available in those markets compared to what is available in cryptocurrencies is orders of magnitude different.
Crypto is an ocean of untapped alpha. Applying theories you've learned growing up to crypto will reward you with years of alpha. And when your primal instincts takeover making you wonder if everything is going to $0, this sort of simple and intuitive way of thinking might make all the difference.
As an example, let's use the 200-day moving average. The simple variety. Nothing special like the exponential version here.
It's a simple metric. The 200dMA is used to as a general trend indicator. If price is above the 200dMA, the trend is bullish. Below... Bearish.
Simple, right? Above, good. Below, bad.
This might sound odd, but this strategy flies in the face of some financial analysts that believe in random walks and the efficient market hypothesis. This is your midcurvers. The ones who will debate themselves silly and begin going down a path where 1+1 could theoretically be 5.
Avoid this world.
I encourage us to instead look at the data. Trends are a real thing in markets (ie - One of many papers saying so). Meaning we can use this 200dMA to help us guess with better results that price at some point in the near future is likely to be up versus down if the price currently sits above a 200dMA. Paul Tudor Jones likely agrees on this one.
But this is crypto. Not stock markets.
Assets have emission rates and changes in "shares outstanding" that are trading in the market. Not to mention, the asset itself is used to pay for a fee to transact.
This would be like owning TSLA stock, and paying to trade TSLA stock using TSLA. It's why Cryptocurrencies can have reflexivity in ways that stock shares can't.
Not to mention you can't lock up TSLA as collateral to earn "X.com" shares, easily borrow capital against it, or earn Tesla charging credits (I said easily on purpose here).
Just imagine how many TSLA holders would buy into something like this?
Hopefully you can see how a simple 200dMA metric can quickly get complicated if you layer in a second metric.
So we need to be careful when doing so.
But it's true that it's important to understand the liquidity profile of a token's supply, demand of the asset via network transactions, the changing cost of the transaction fee, future supply issuance, how many tokens are used as collateral for borrowing, and so many other factors.
Can we bring in another metric here in an intuitive and straight forward way? If you see the scroll icon on the right-hand side, you can see there is still a good amount of text remaining, so you can assume we're going to give it a try.
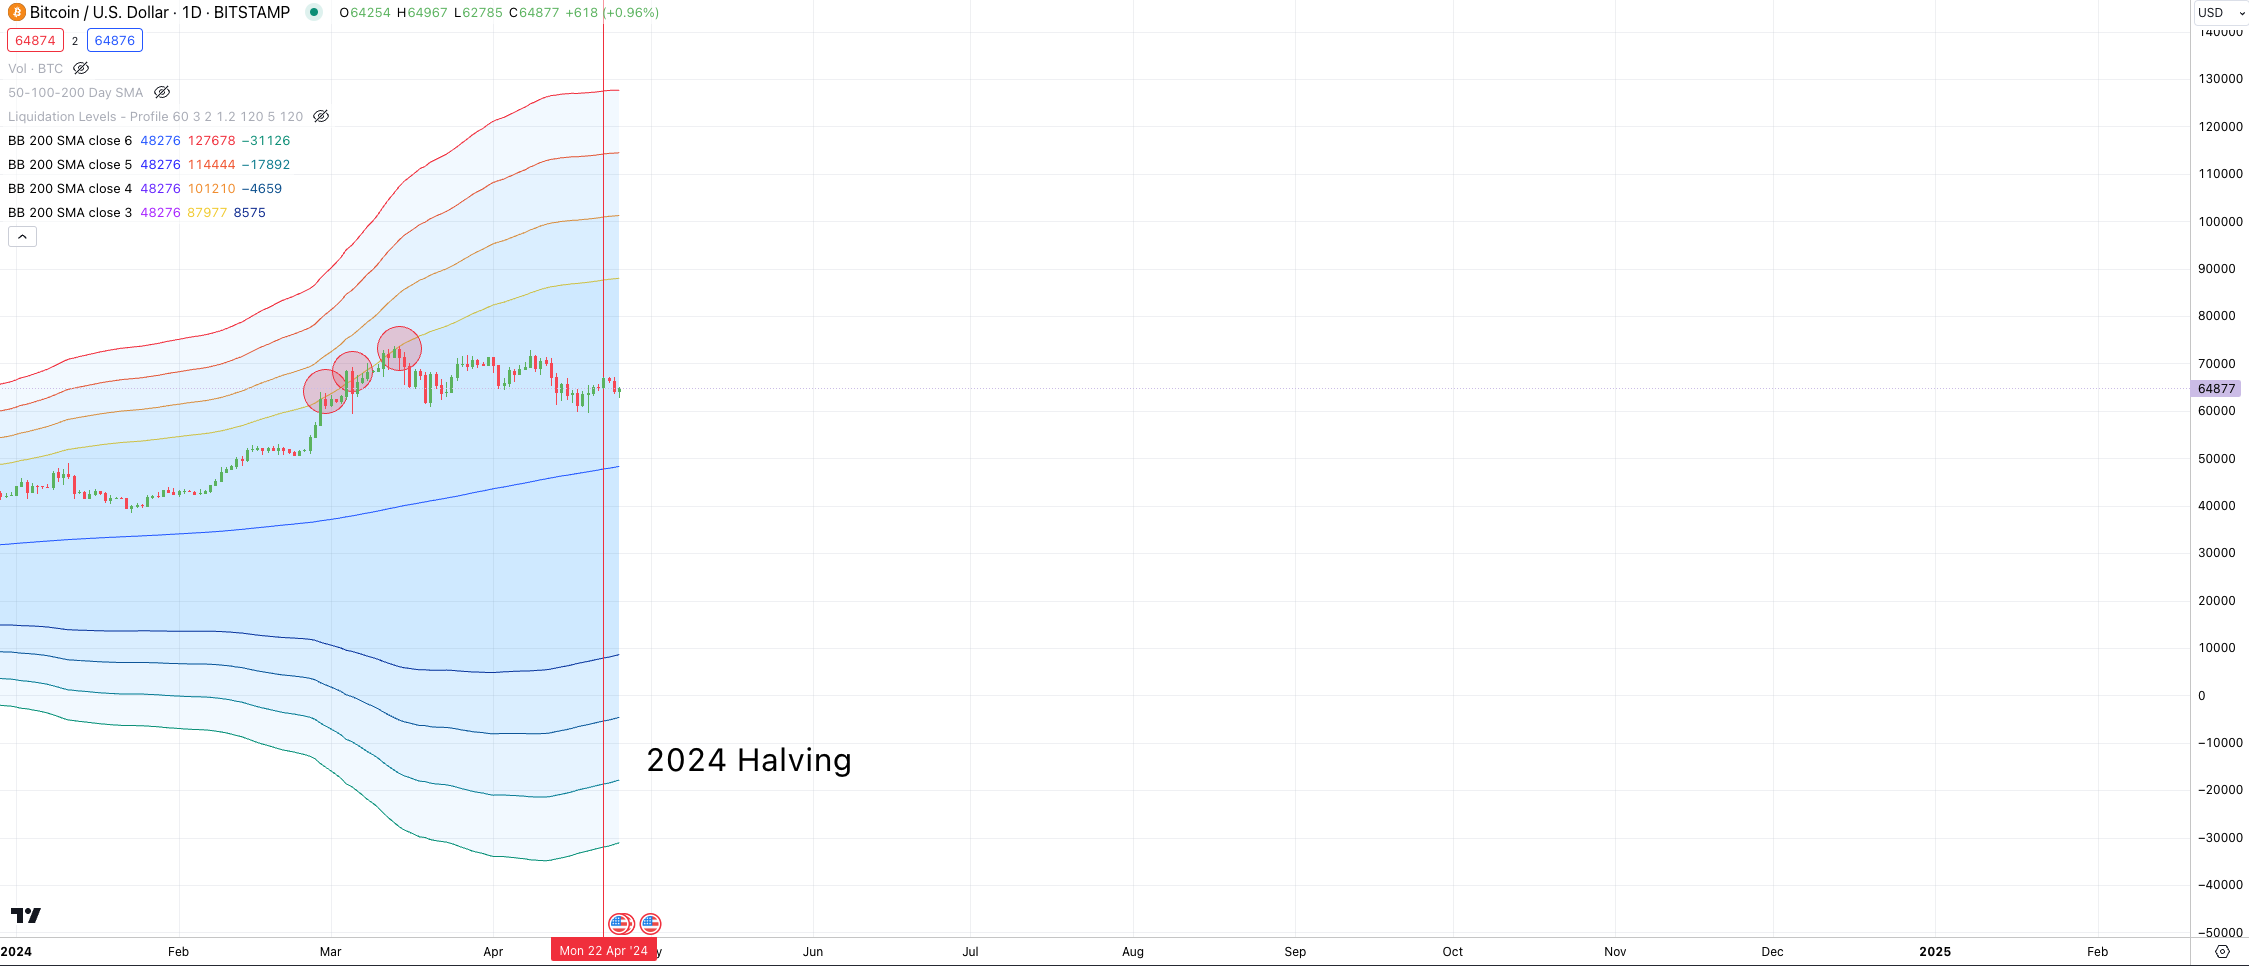
Let's take the most convenient one I can think of due to how recently its happened - the Bitcoin halving.
It's not necessarily a metric, but a point in time.
One where the market's supply dynamics change... Something that doesn't quite exist in the stock market with the same predictability.
OK, so what I'll do is look at price after the halving and how it behaves relative to the 200dMA.
Why? Because we want to be able to measure up our opponent, use strategy, and dominant even if primal forces are washing over us during 10% selloffs.
The Analysis
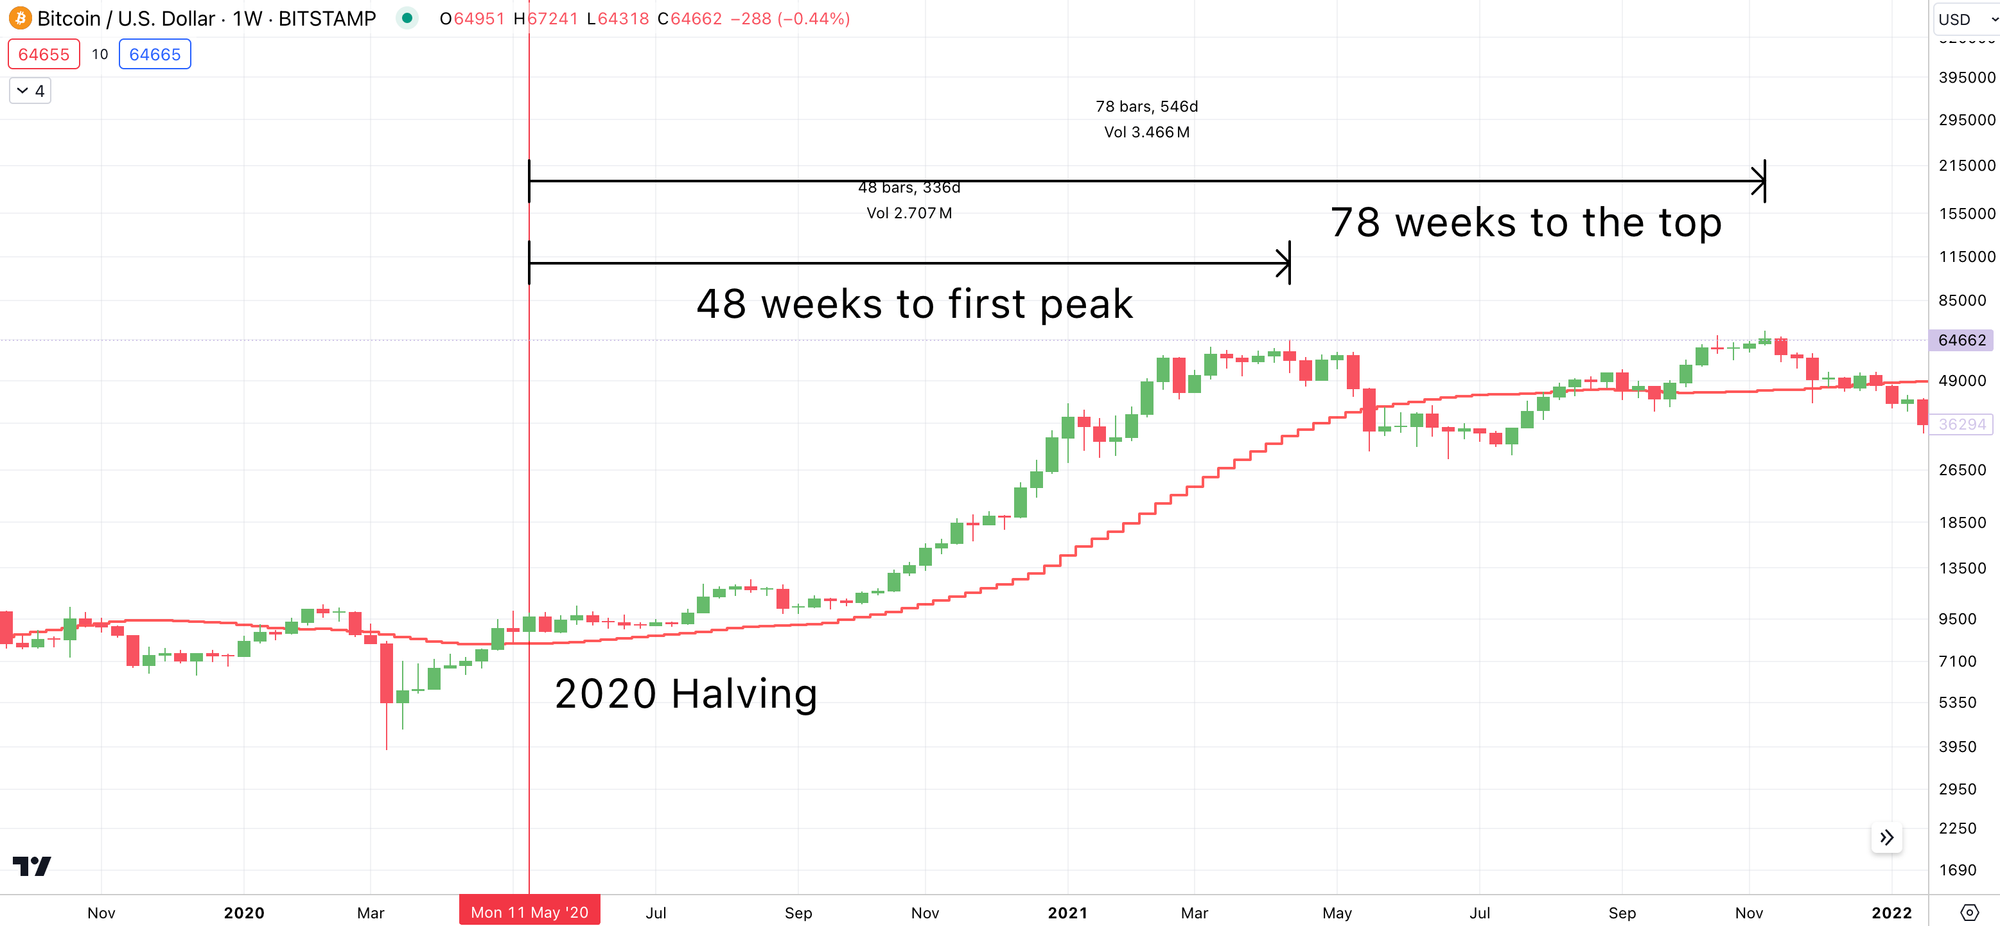
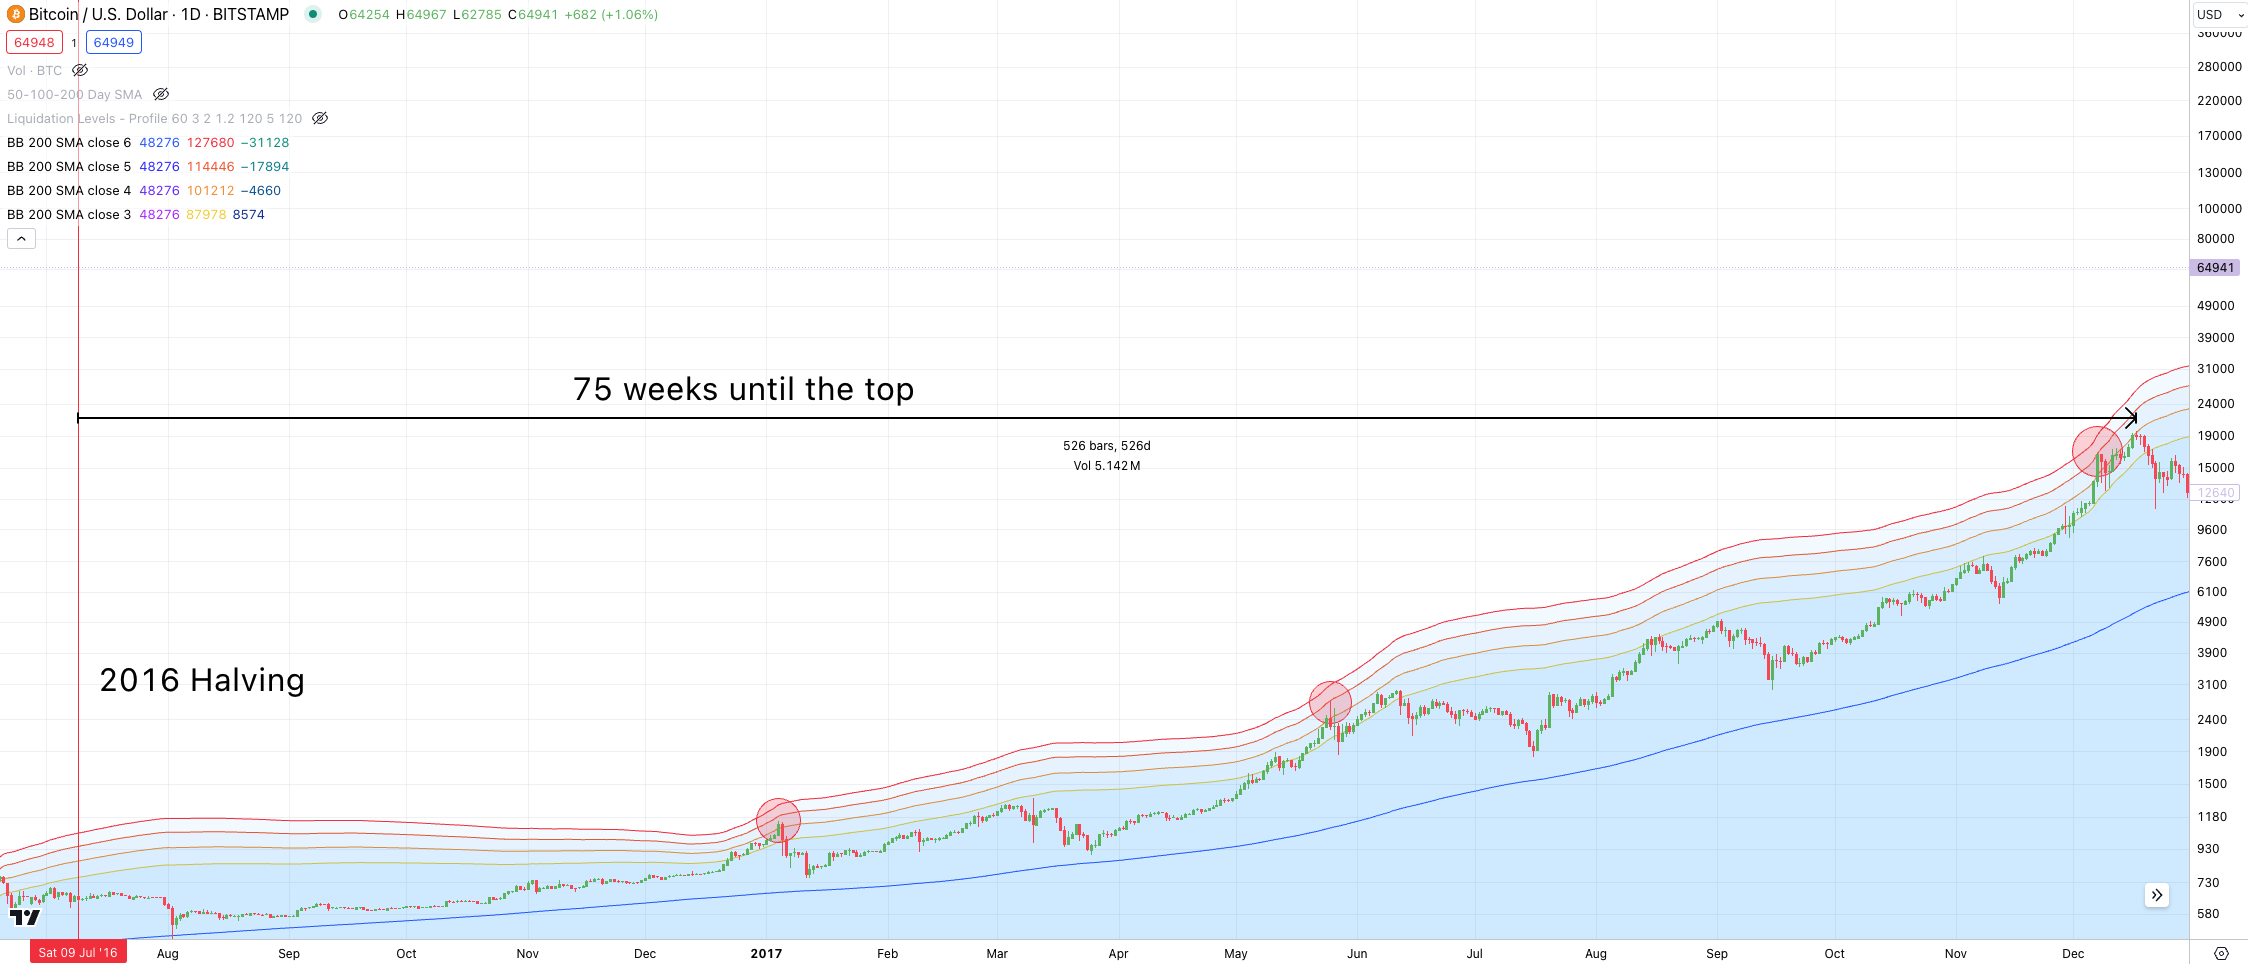
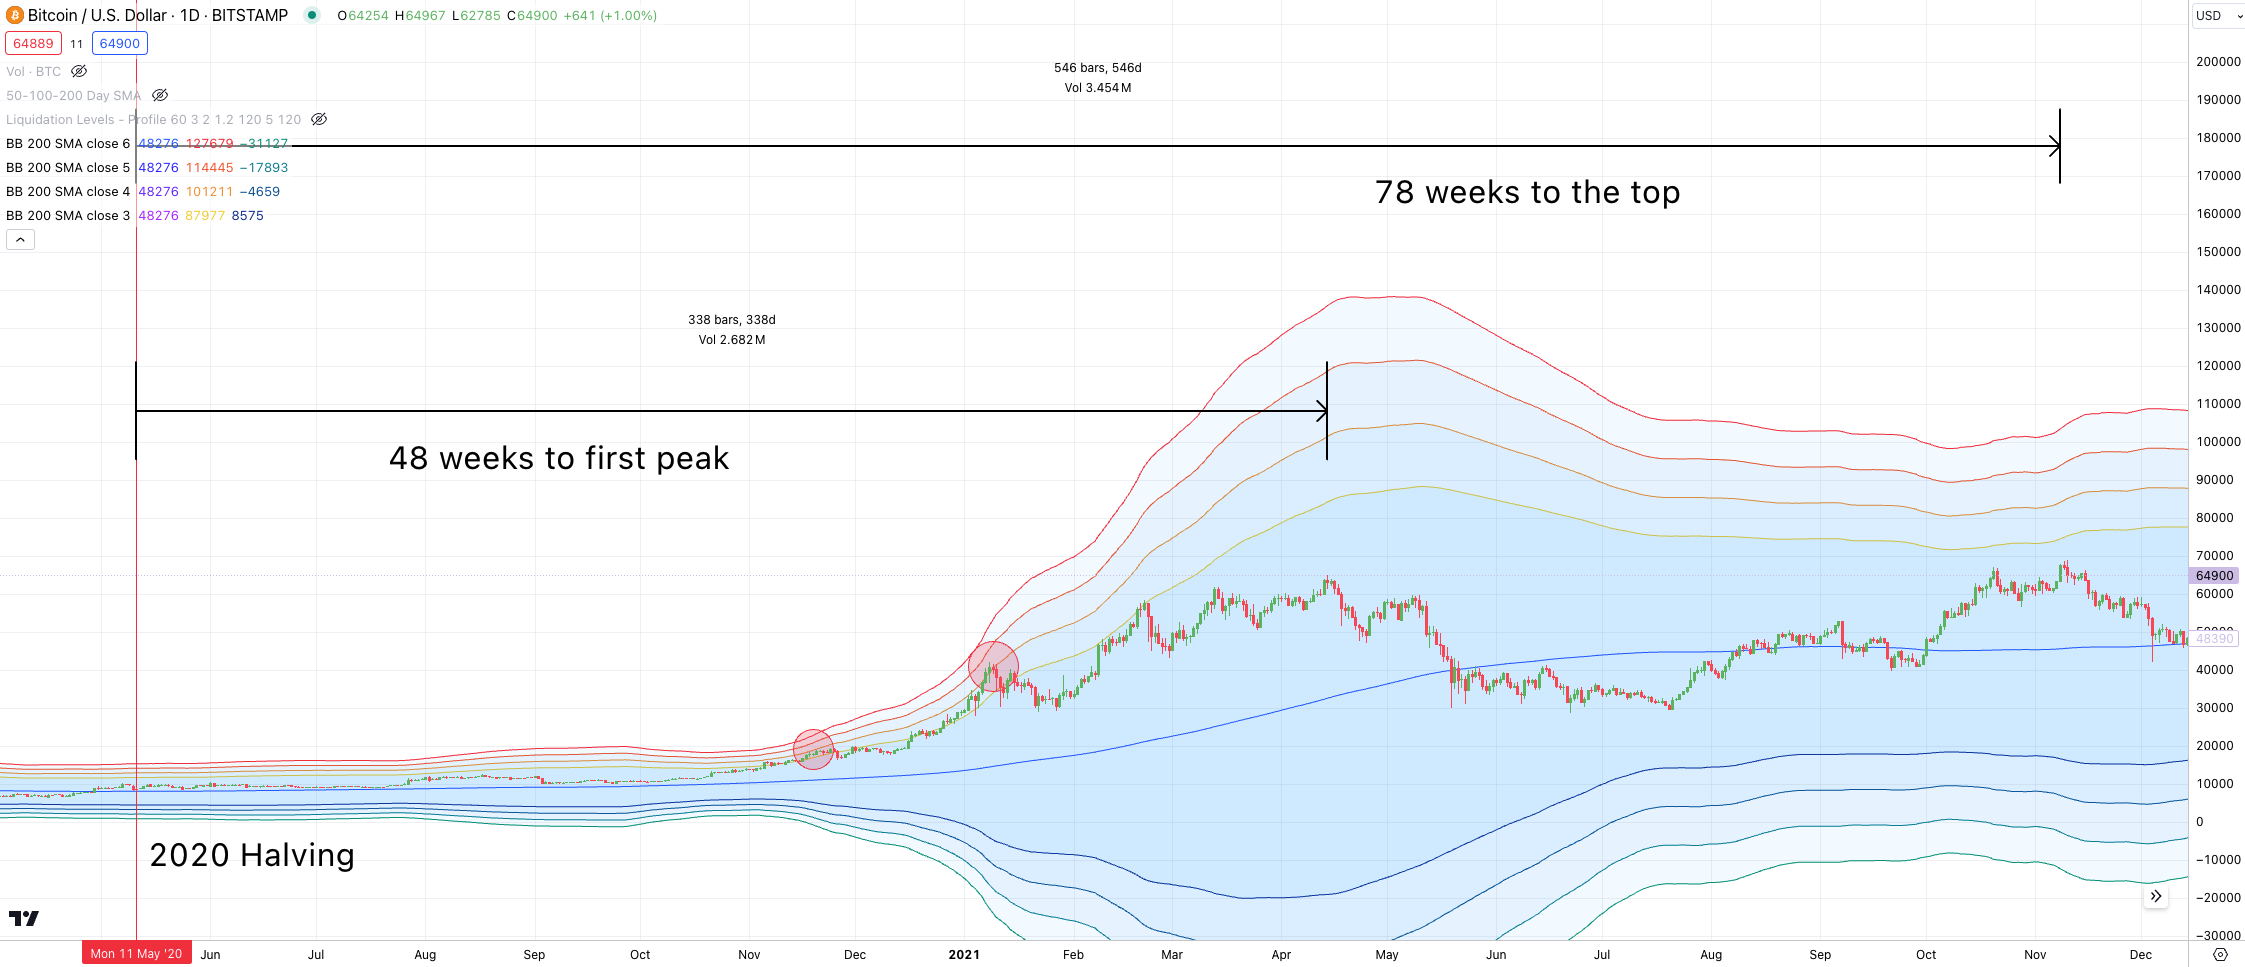
Let's start off by looking at the 2020 halving.
I use red vertical lines in the chart for this. Each candle represents one week - a weekly chart. And the red stair-step horizontal line is the 200d MA.
Now, from the time the halving happened and until its next major peak, 48 weeks passed. Almost one year. During that time price went from below $10,000 to more than $60,000, and price never closed below the 200d MA. Nice.
The pico top ticked price happened in 78 weeks, but price lost the 200d MA before this date.
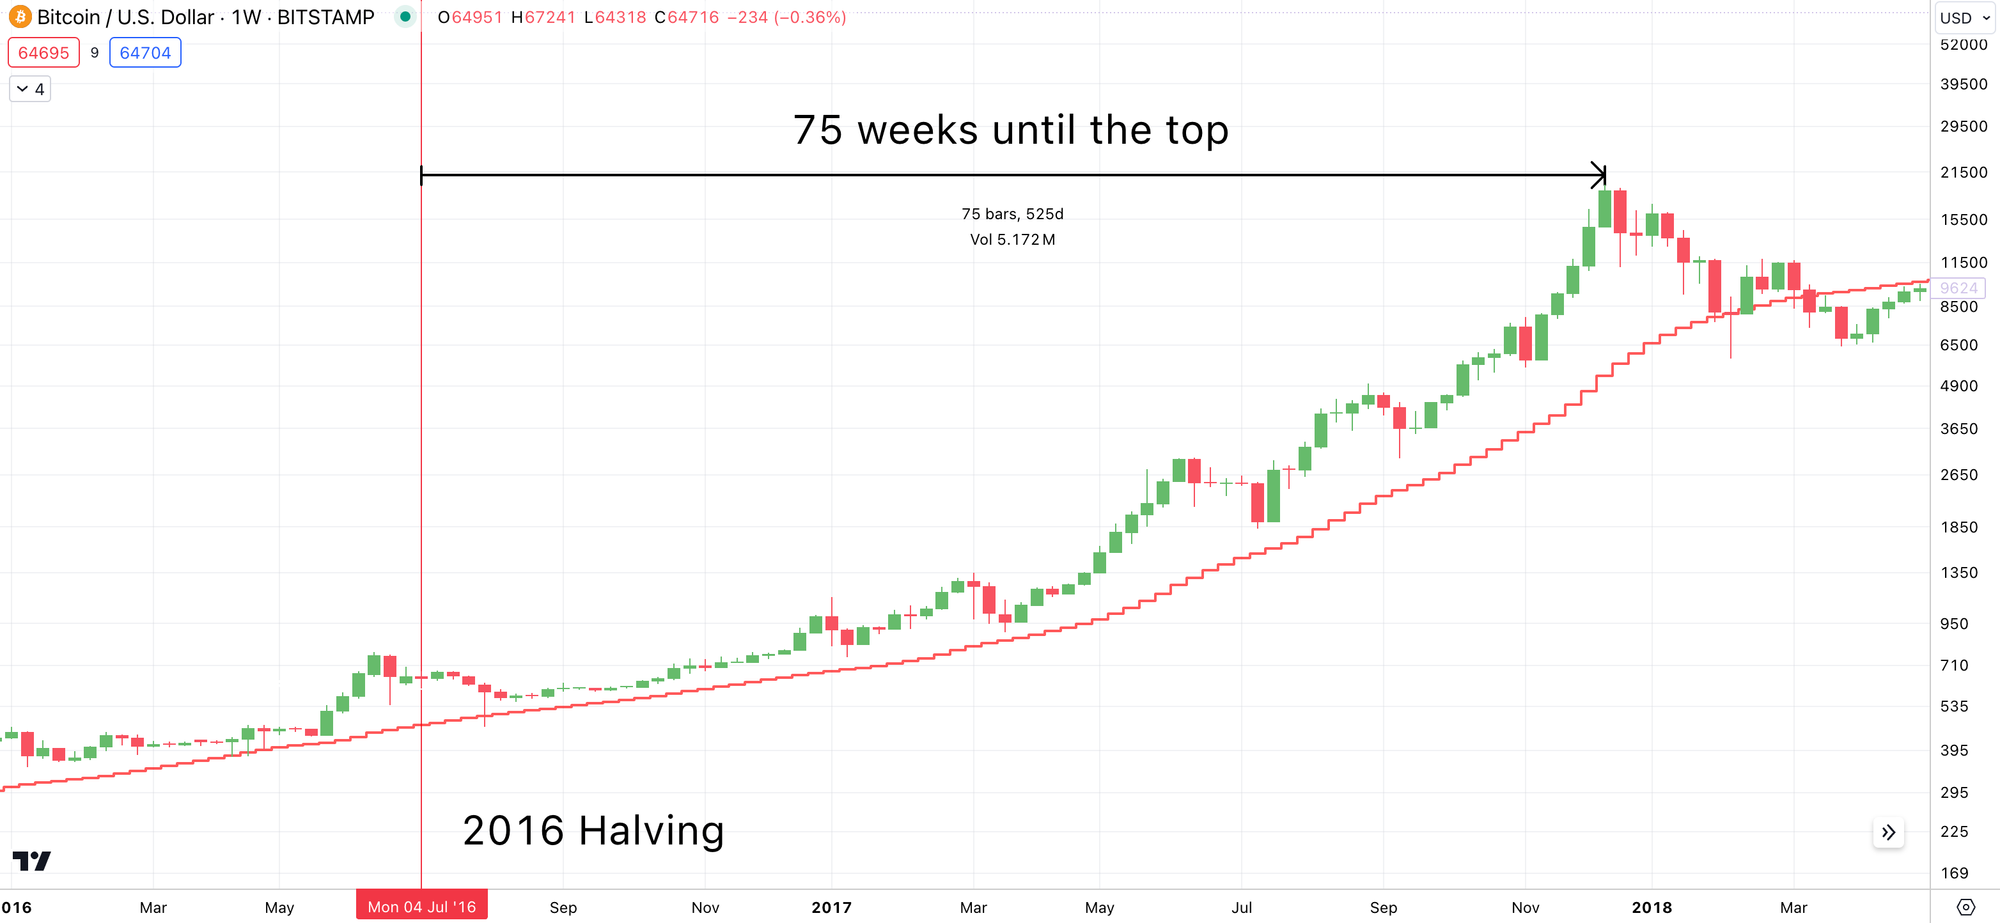
Now let's look at the halving from 2016.
75 weeks from when the halving to the peak. Again, price never closed below the 200dMA
Then there's 2012. One year until the top. Price never closed below the 200d MA.
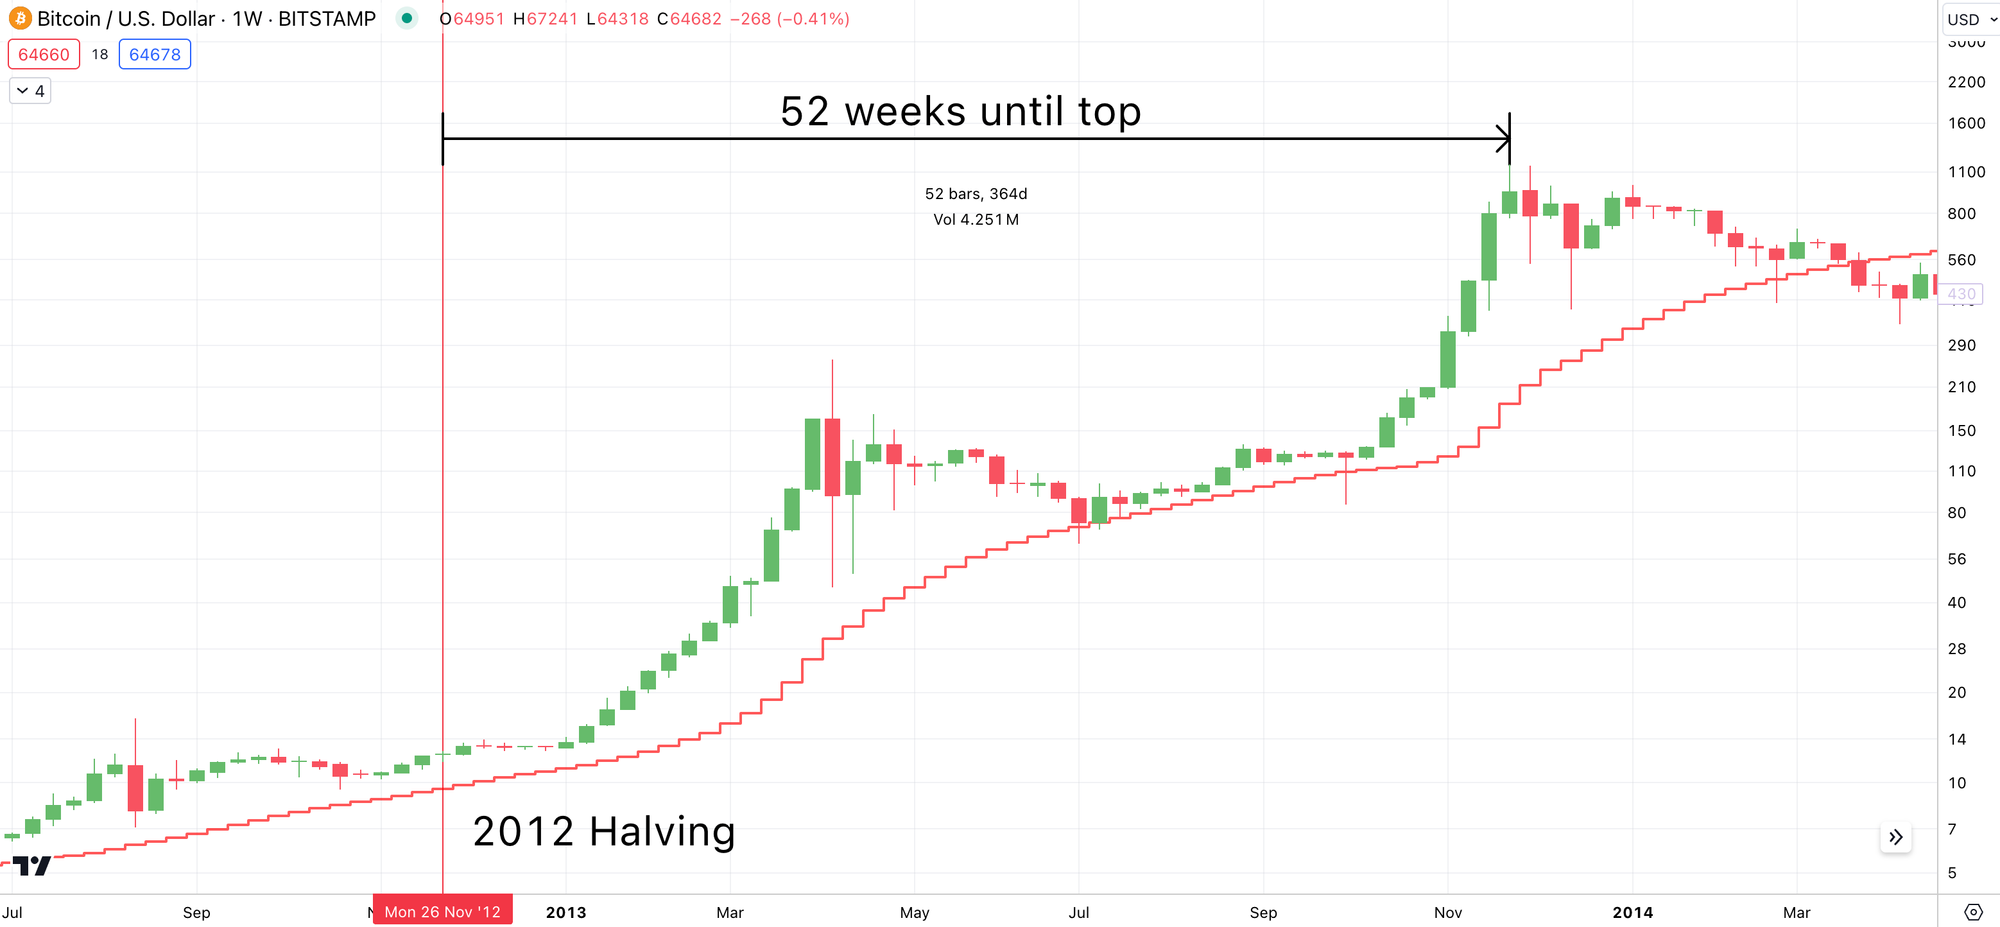
Now, these charts have a few things in common. The first is that after a halving, it took price about a year before it fell below the 200d MA on a weekly chart.
They also all show price between 20-38% above the 200dMA at the weekly close on the week in which a halving took place.
Same range we fall into today.
This forces myself to ask, are things any different?
Sure, a lot of stuff is happening in macro. Powell is doing things with rates. Wars are happening. Japan...Russia...gold...net liquidity...
Hopefully you see my point, which is, no need to get overly complicated.
This, coming from an analyst that watches yields in both crypto and globally to better understand the cost of an asset.
And while this is pretty mundane, we can still take this further to see if anything is different.
The first step will be simple while the second one might be a bit more complicated, but intuitively simple.
The first is quick.
It has to do with price action after the halving, the vertical red line in the charts above.
Scroll up and take a look. Notice those 4-6 candles to the right of that vertical red line.
Notice a similarity?
Price is either sideways or down. Similar to today. Not too different, eh? Makes me really appreciate the timeliness of what JJ is saying regarding the May monthly options contracts. There is heightened interest around them, and my thinking is that the May expiry will mark the beginning of the next leg higher.
Just how higher is what this last and second part is about.
The Bands
This week one of the analysts did some work on various ways to measure volatility. It brought forward a lot of discussion around strengths and weaknesses of various ways of measuring it.
And even how some of these measurements aren't great for cryptocurrency assets that can move orders of magnitude in a very short period of time.
During this time we reflected on how nice the Bollinger Band metric was. For anybody that understands statistics, this way of looking at the distribution of recent price action in time-series form is awesome.
If you were to pull up Bollinger Band right now on your chart, you'll likely get a default period of "20". This is the amount of previous candles that will be used to determine what the average price is. The bands will sit at a default of 2 standard deviations, which tells you where 95% of the previous 20 candle closes sit.
Meaning if price goes outside of these bands, it's an unlikely event. It's a nice mean reversion metric.
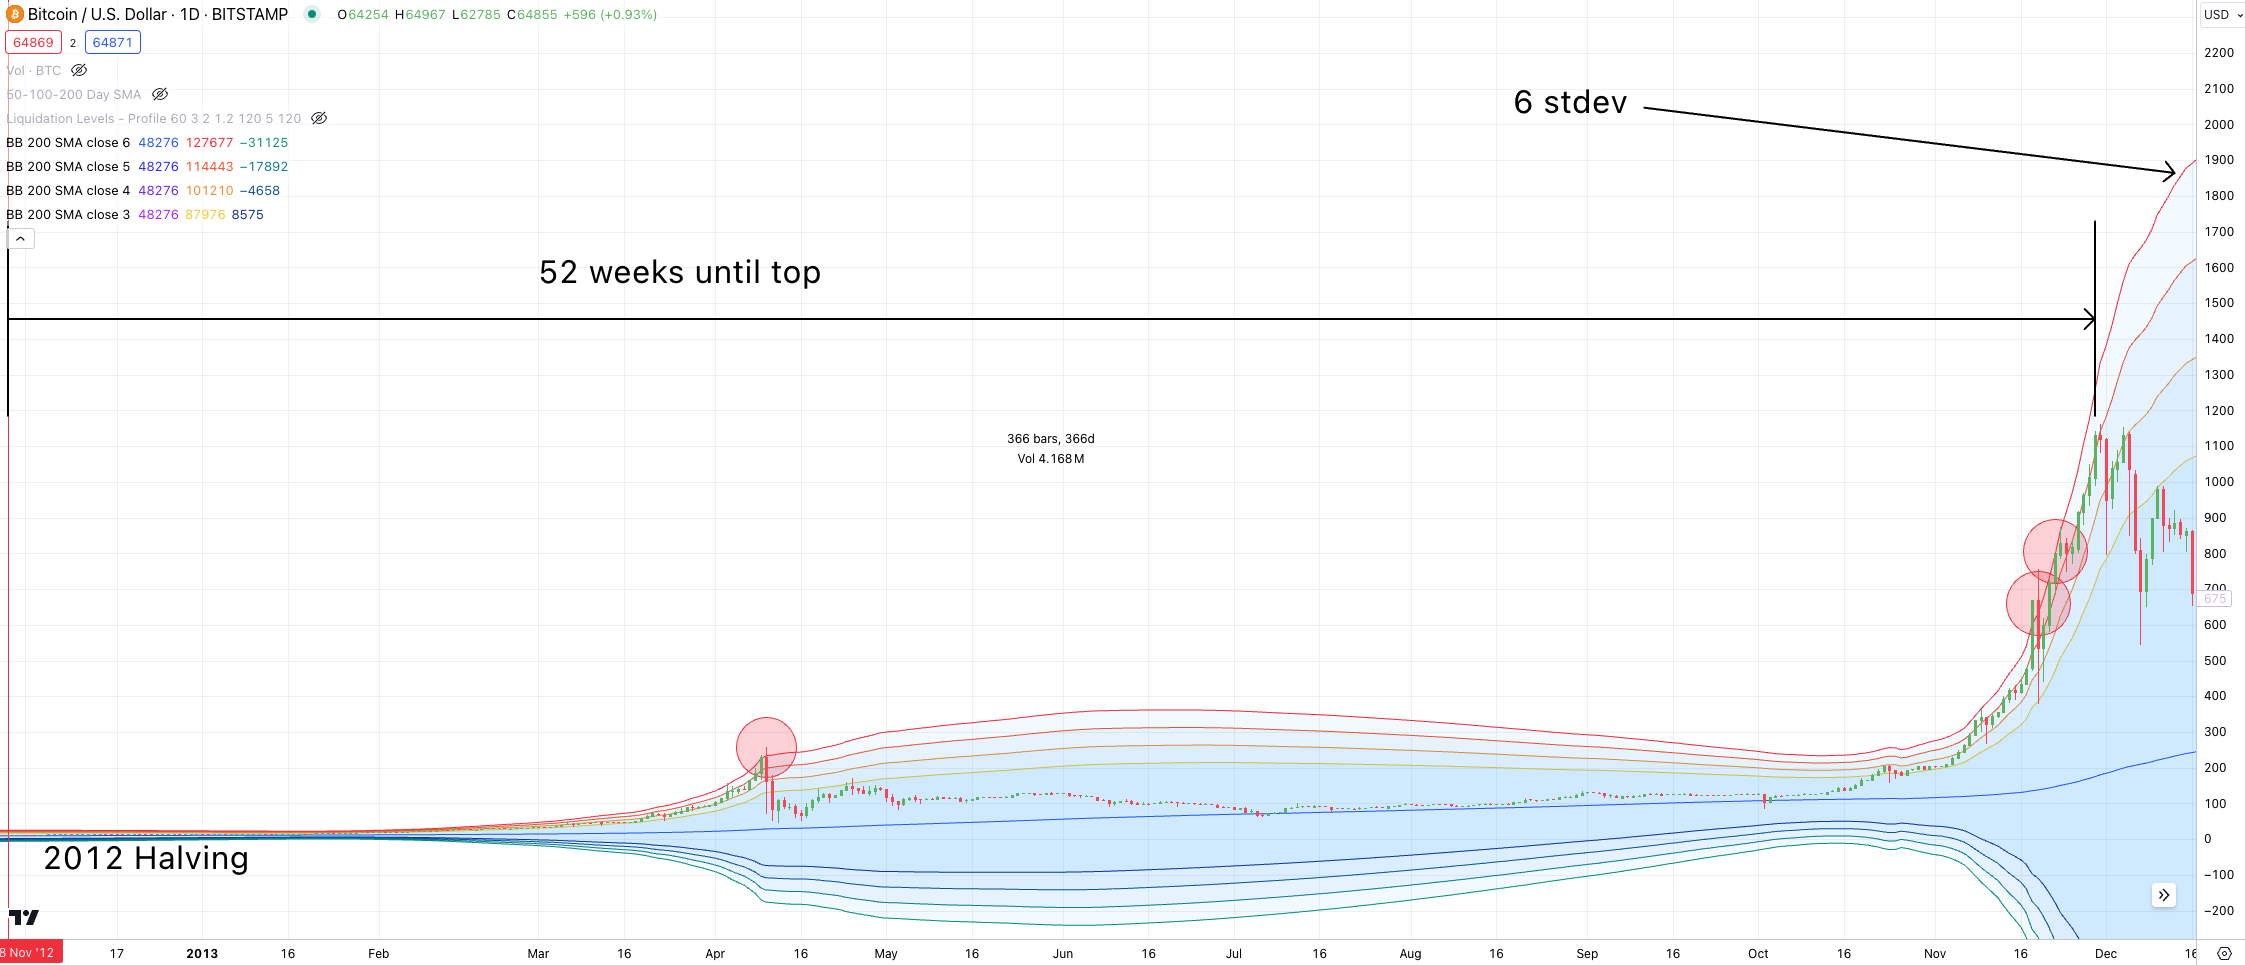
Well, if we tweak the settings a bit... And use the 200d MA from before... Then layer in a series of new standard deviations of let's say 3, 4, 5, 6... Something interesting happens.
Price moves less to the upside each halving cycle. Less extreme.
Here's 2012. Notice how price reacts around the Bollinger Band with settings 200d MA and 6 stdev. I highlighted the taps in red.
Here's 2016. Notice how price reacts around the Bollinger Band with settings 200d MA and 5 stdev.
Now on to 2020. This time, notice the 4 stdev setting BBand.
What's also interesting here is that the run up prior to each halving, price respected the same Bolling Band settings. Meaning in 2020, price respected the 4stdev setting. 2016 the 5 stdev.
And in 2024... Same deal. Only this time it's the 3stdev setting.
Price is respecting the same sequence as before.
Which is all to say this cycle is still predictable, controllable.
Use that to your advantage.
Stay calm as we crab walk sideways. The best is yet to come.
Your Pulse on Crypto,
Ben Lilly
P.S. - In case you haven't seen this video, I'd encourage you to have a watch. It helps people understand these cycles in terms of which asset's within crypto move at certain points in time.


