Pareidolia
Market update

Each day it takes place.
It could be seen with a simple crack in the sidewalk. Or a cloud in the sky.
Our mind plays simple tricks on us where we see a crack that resembles a smile or a massive cloud forming what appears to be a UFO portal into space.
It’s called Pareidolia.
And it’s the tendency for one’s perception to impose a meaningful interpretation on a stimulus so that one sees an object, pattern or meaning where in fact there is none.
In trading we call it a bias.
And today I’ll showcase how onchain analysts can easily fall victim to it based upon current data.
Now, to get readers up to speed… when we spoke last Friday in “When to Strike” we touched on our onchain Feeding Ground Whalemap for BTC. It’s how to view onchain supports and resistances. Here it is with boxes around the areas of interest - $50k and $35k.
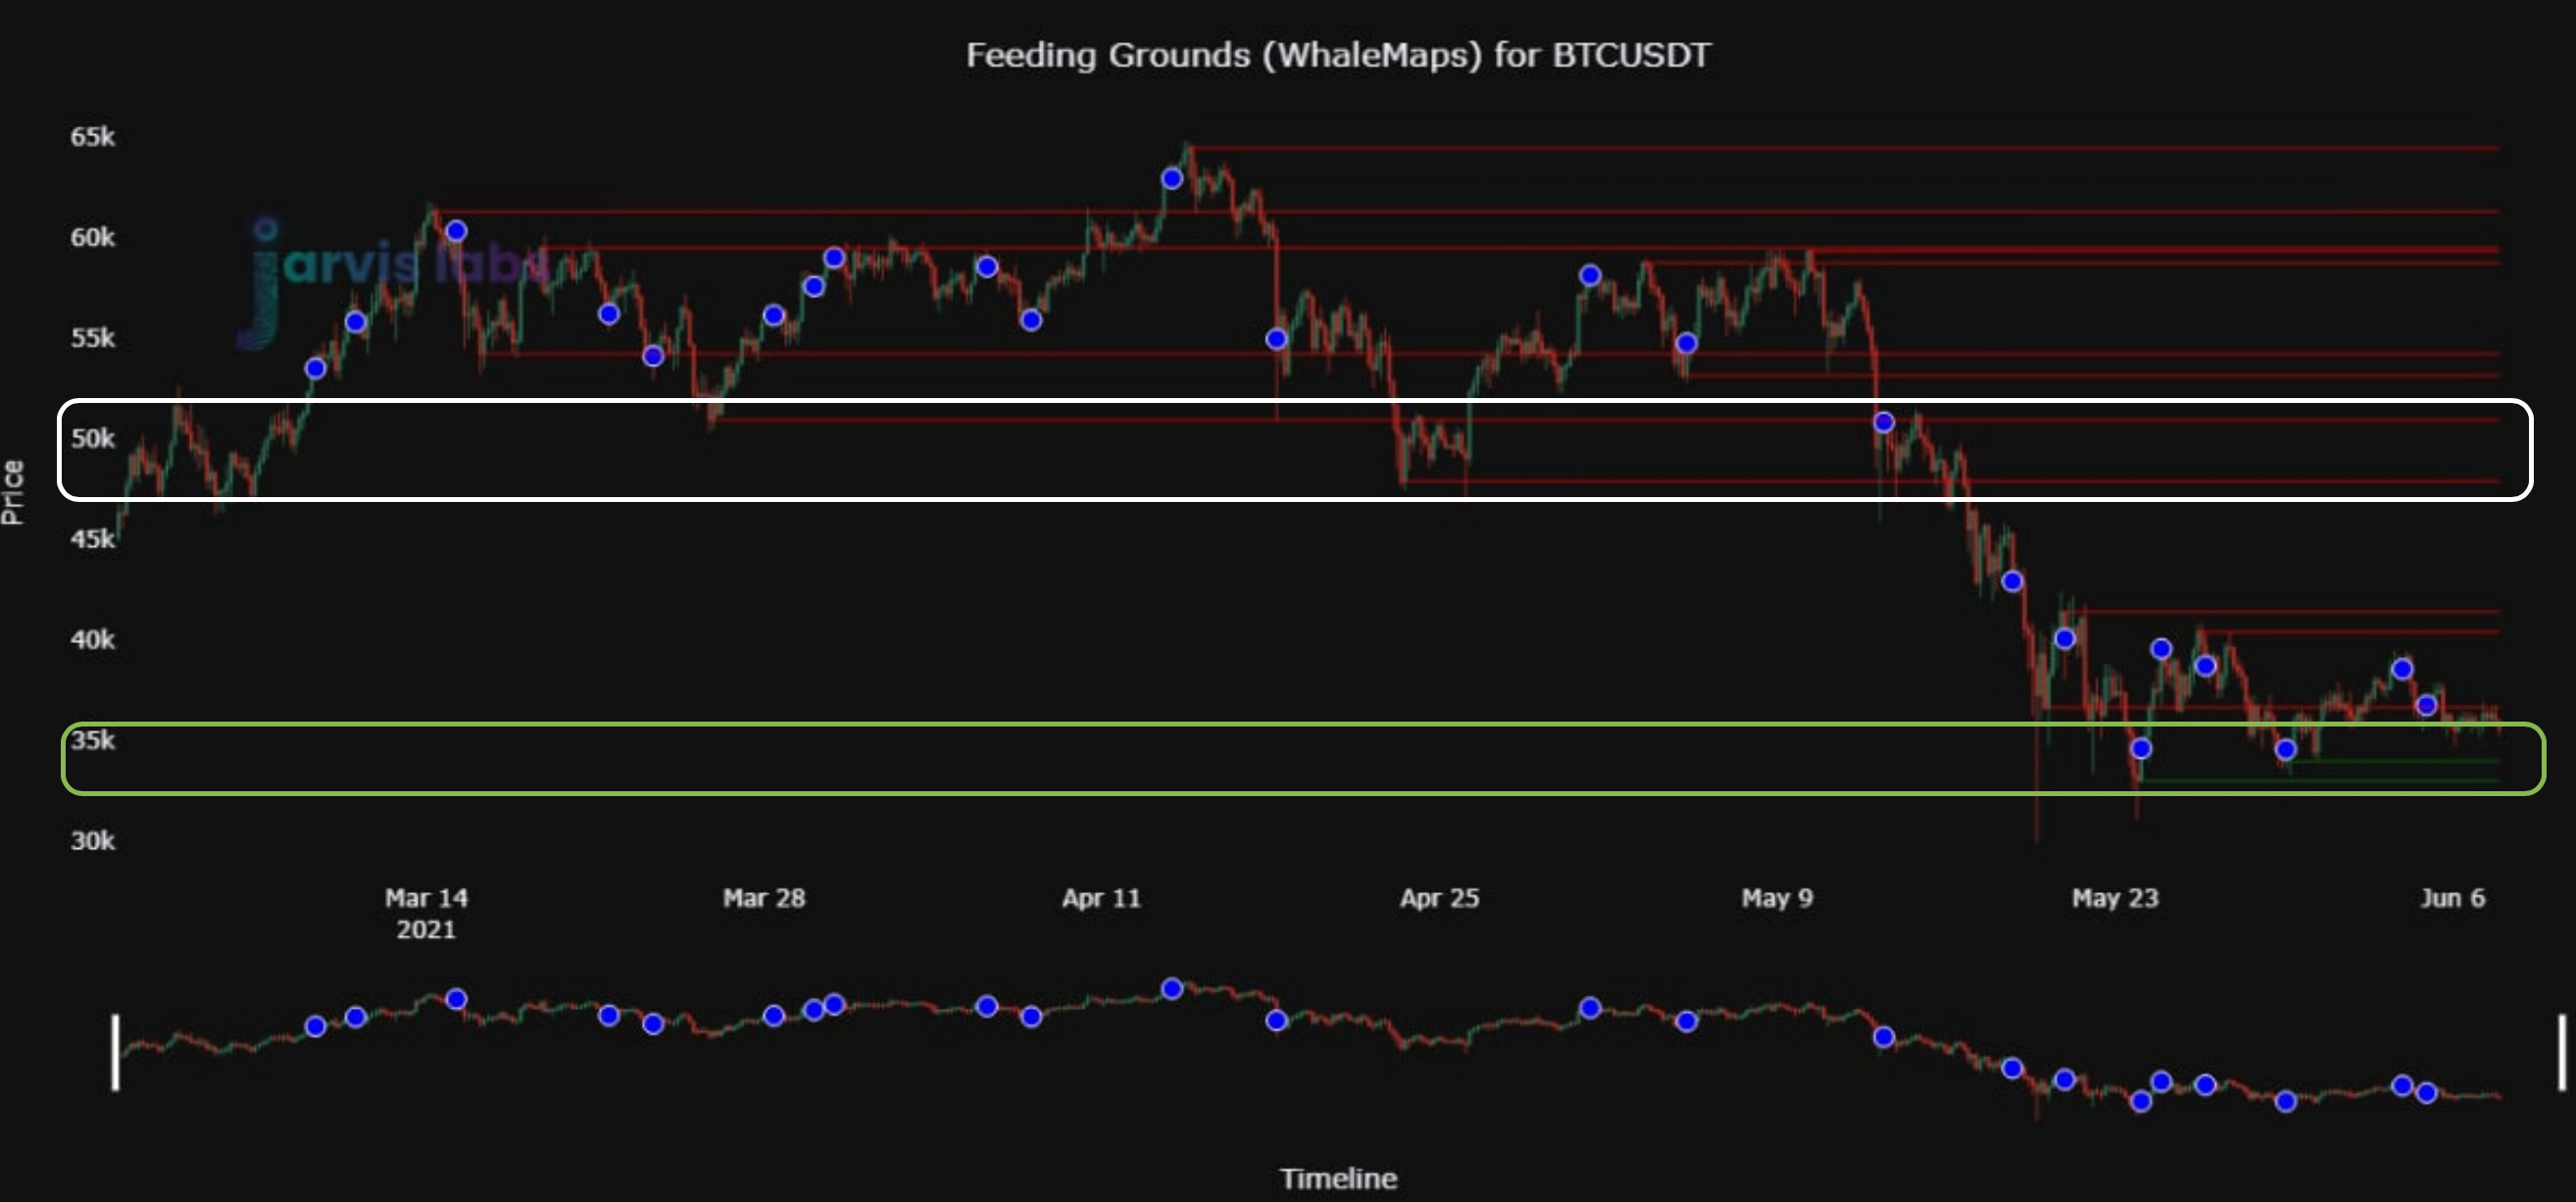
We’ve since moved into the $35k territory.
Now since price entered this area we’ve seen what appears like solid accumulation taking place. Some of you may have even read my tweet over the weekend that touched on it.
Not market movers nor signals, just general moves.. interesting to witness the bag filling taking place at $35k.. This was over the last seven hours.
— Ben Lilly (@MrBenLilly) 11:26 PM ∙ Jun 5, 2021
The alerts didn’t stop there.
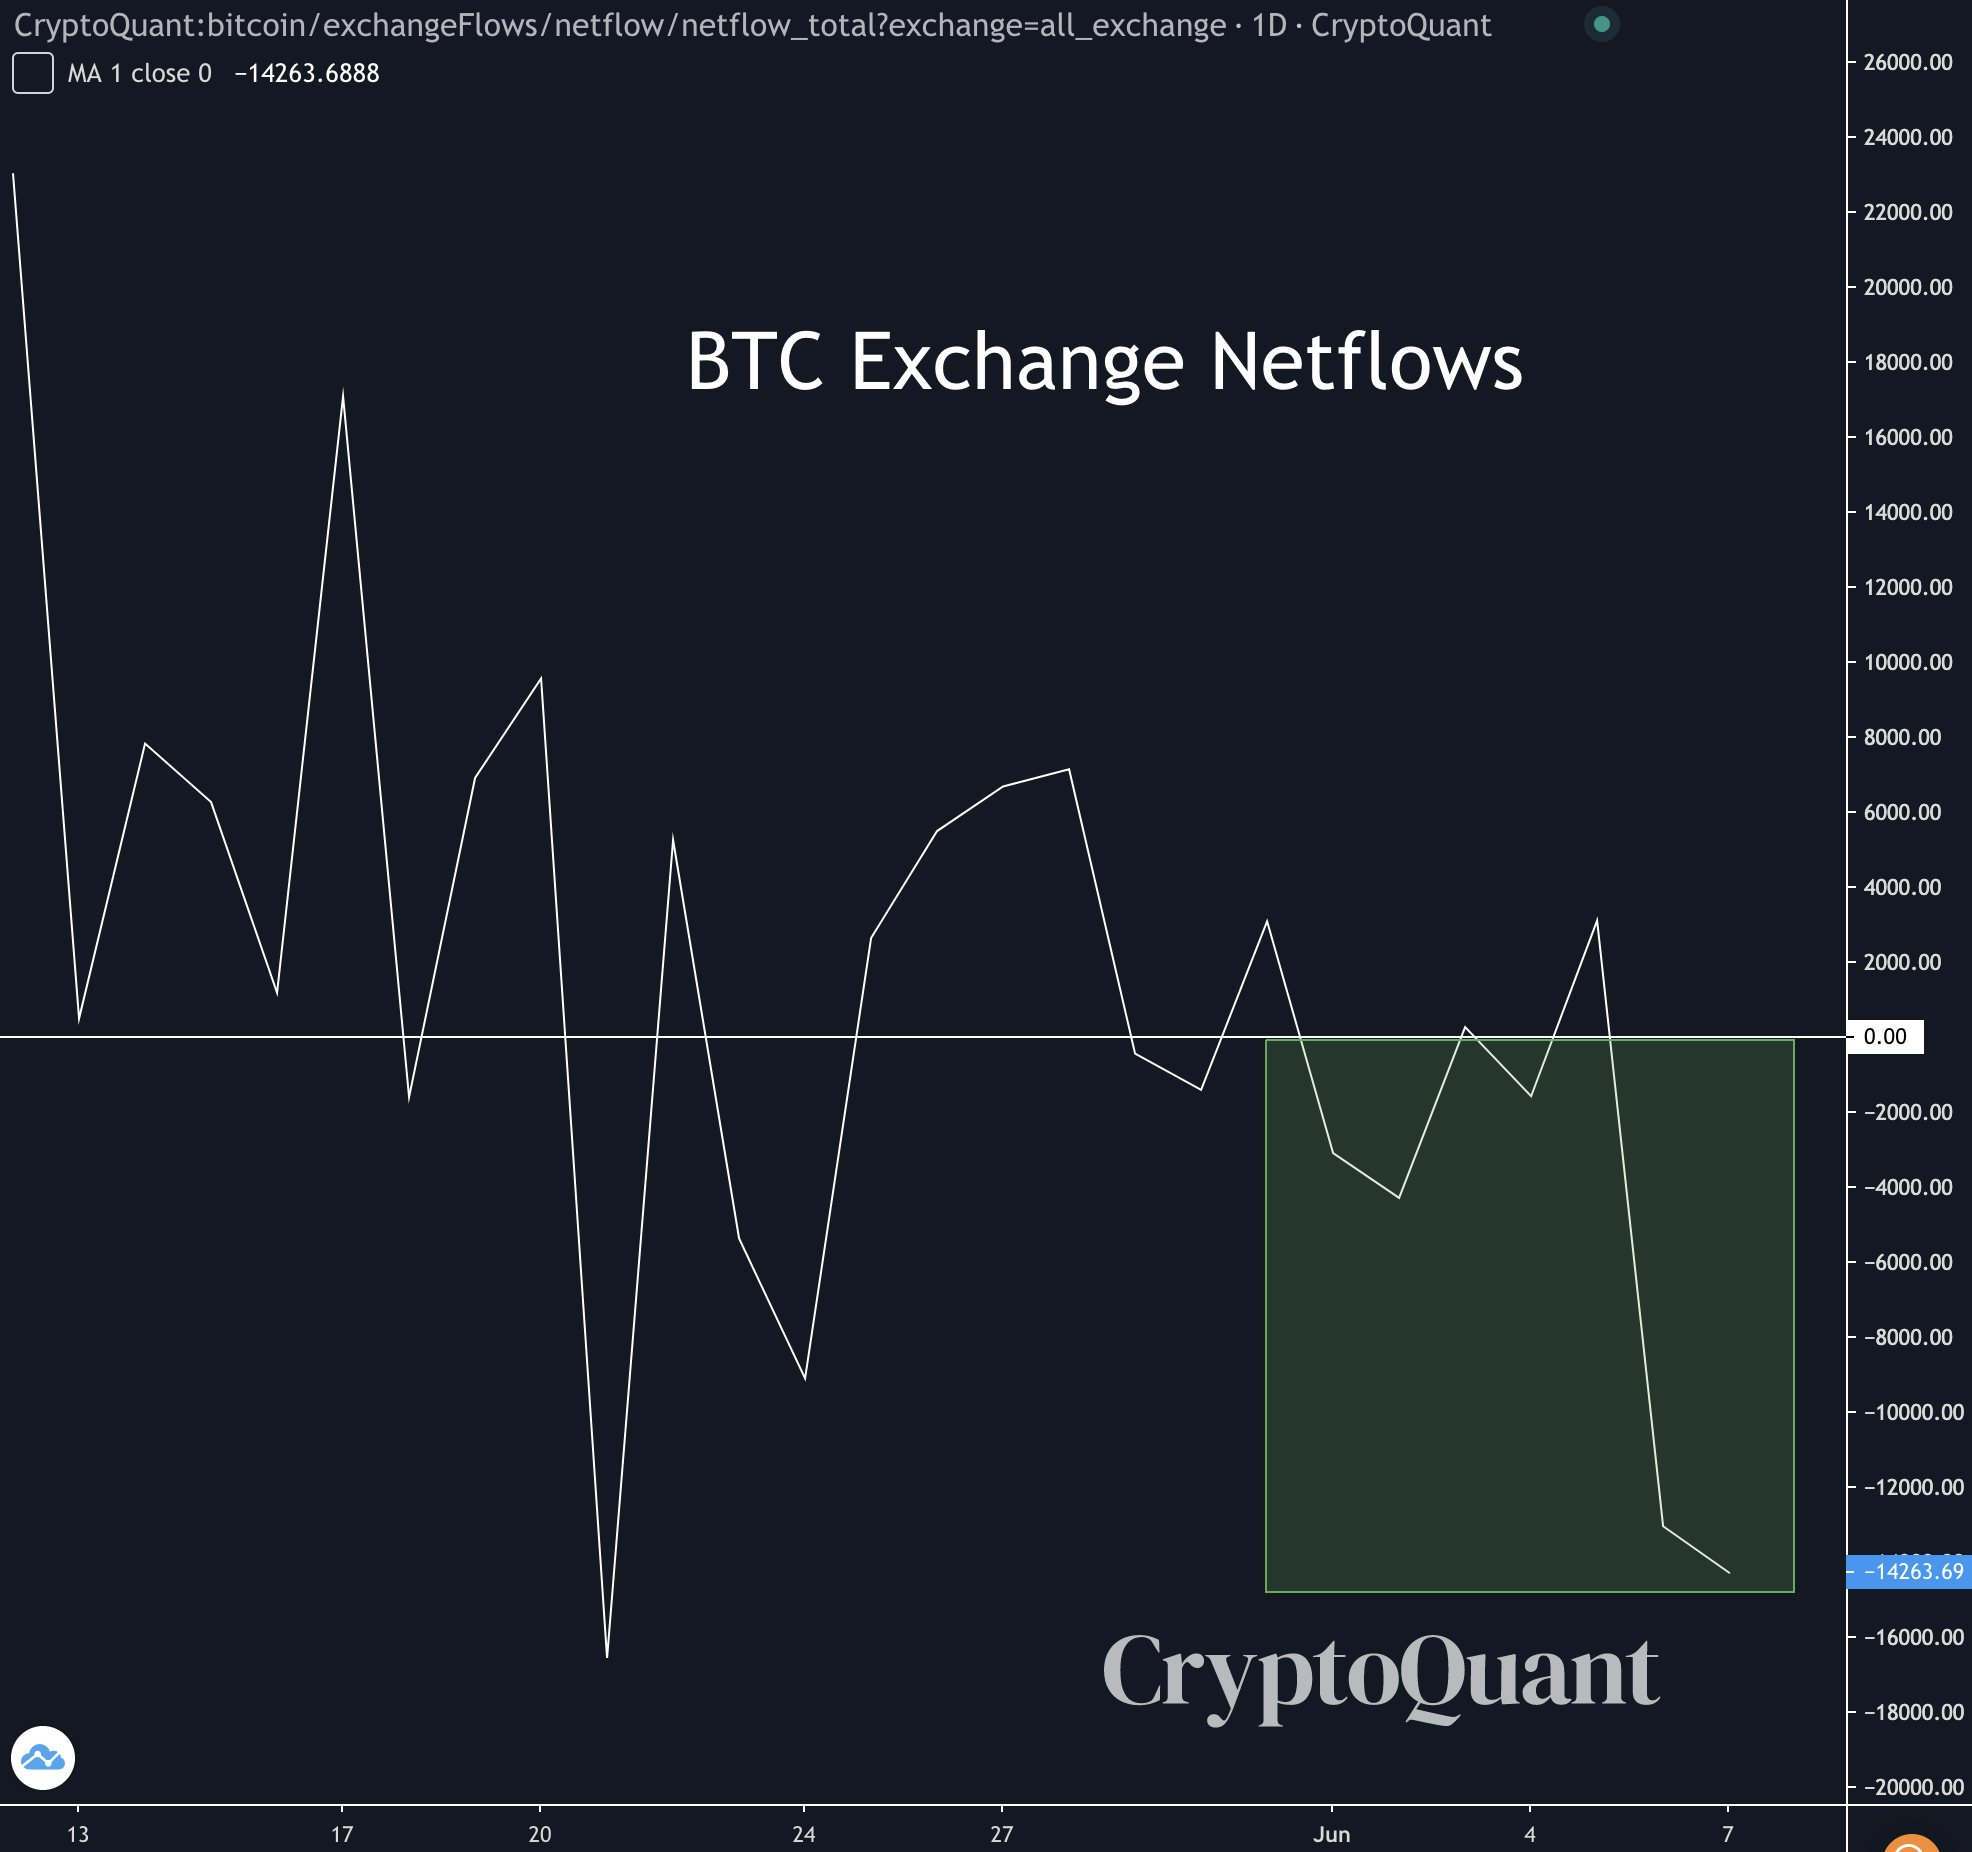
They persisted and continue to trigger our system. Even over the last 24 hours the netflows showed 8k BTC leaving exchanges… Meaning less selling pressure for the market.
Here’s a chart from our friends over at CryptoQuant showing about 28k BTC leaving over the weekend.
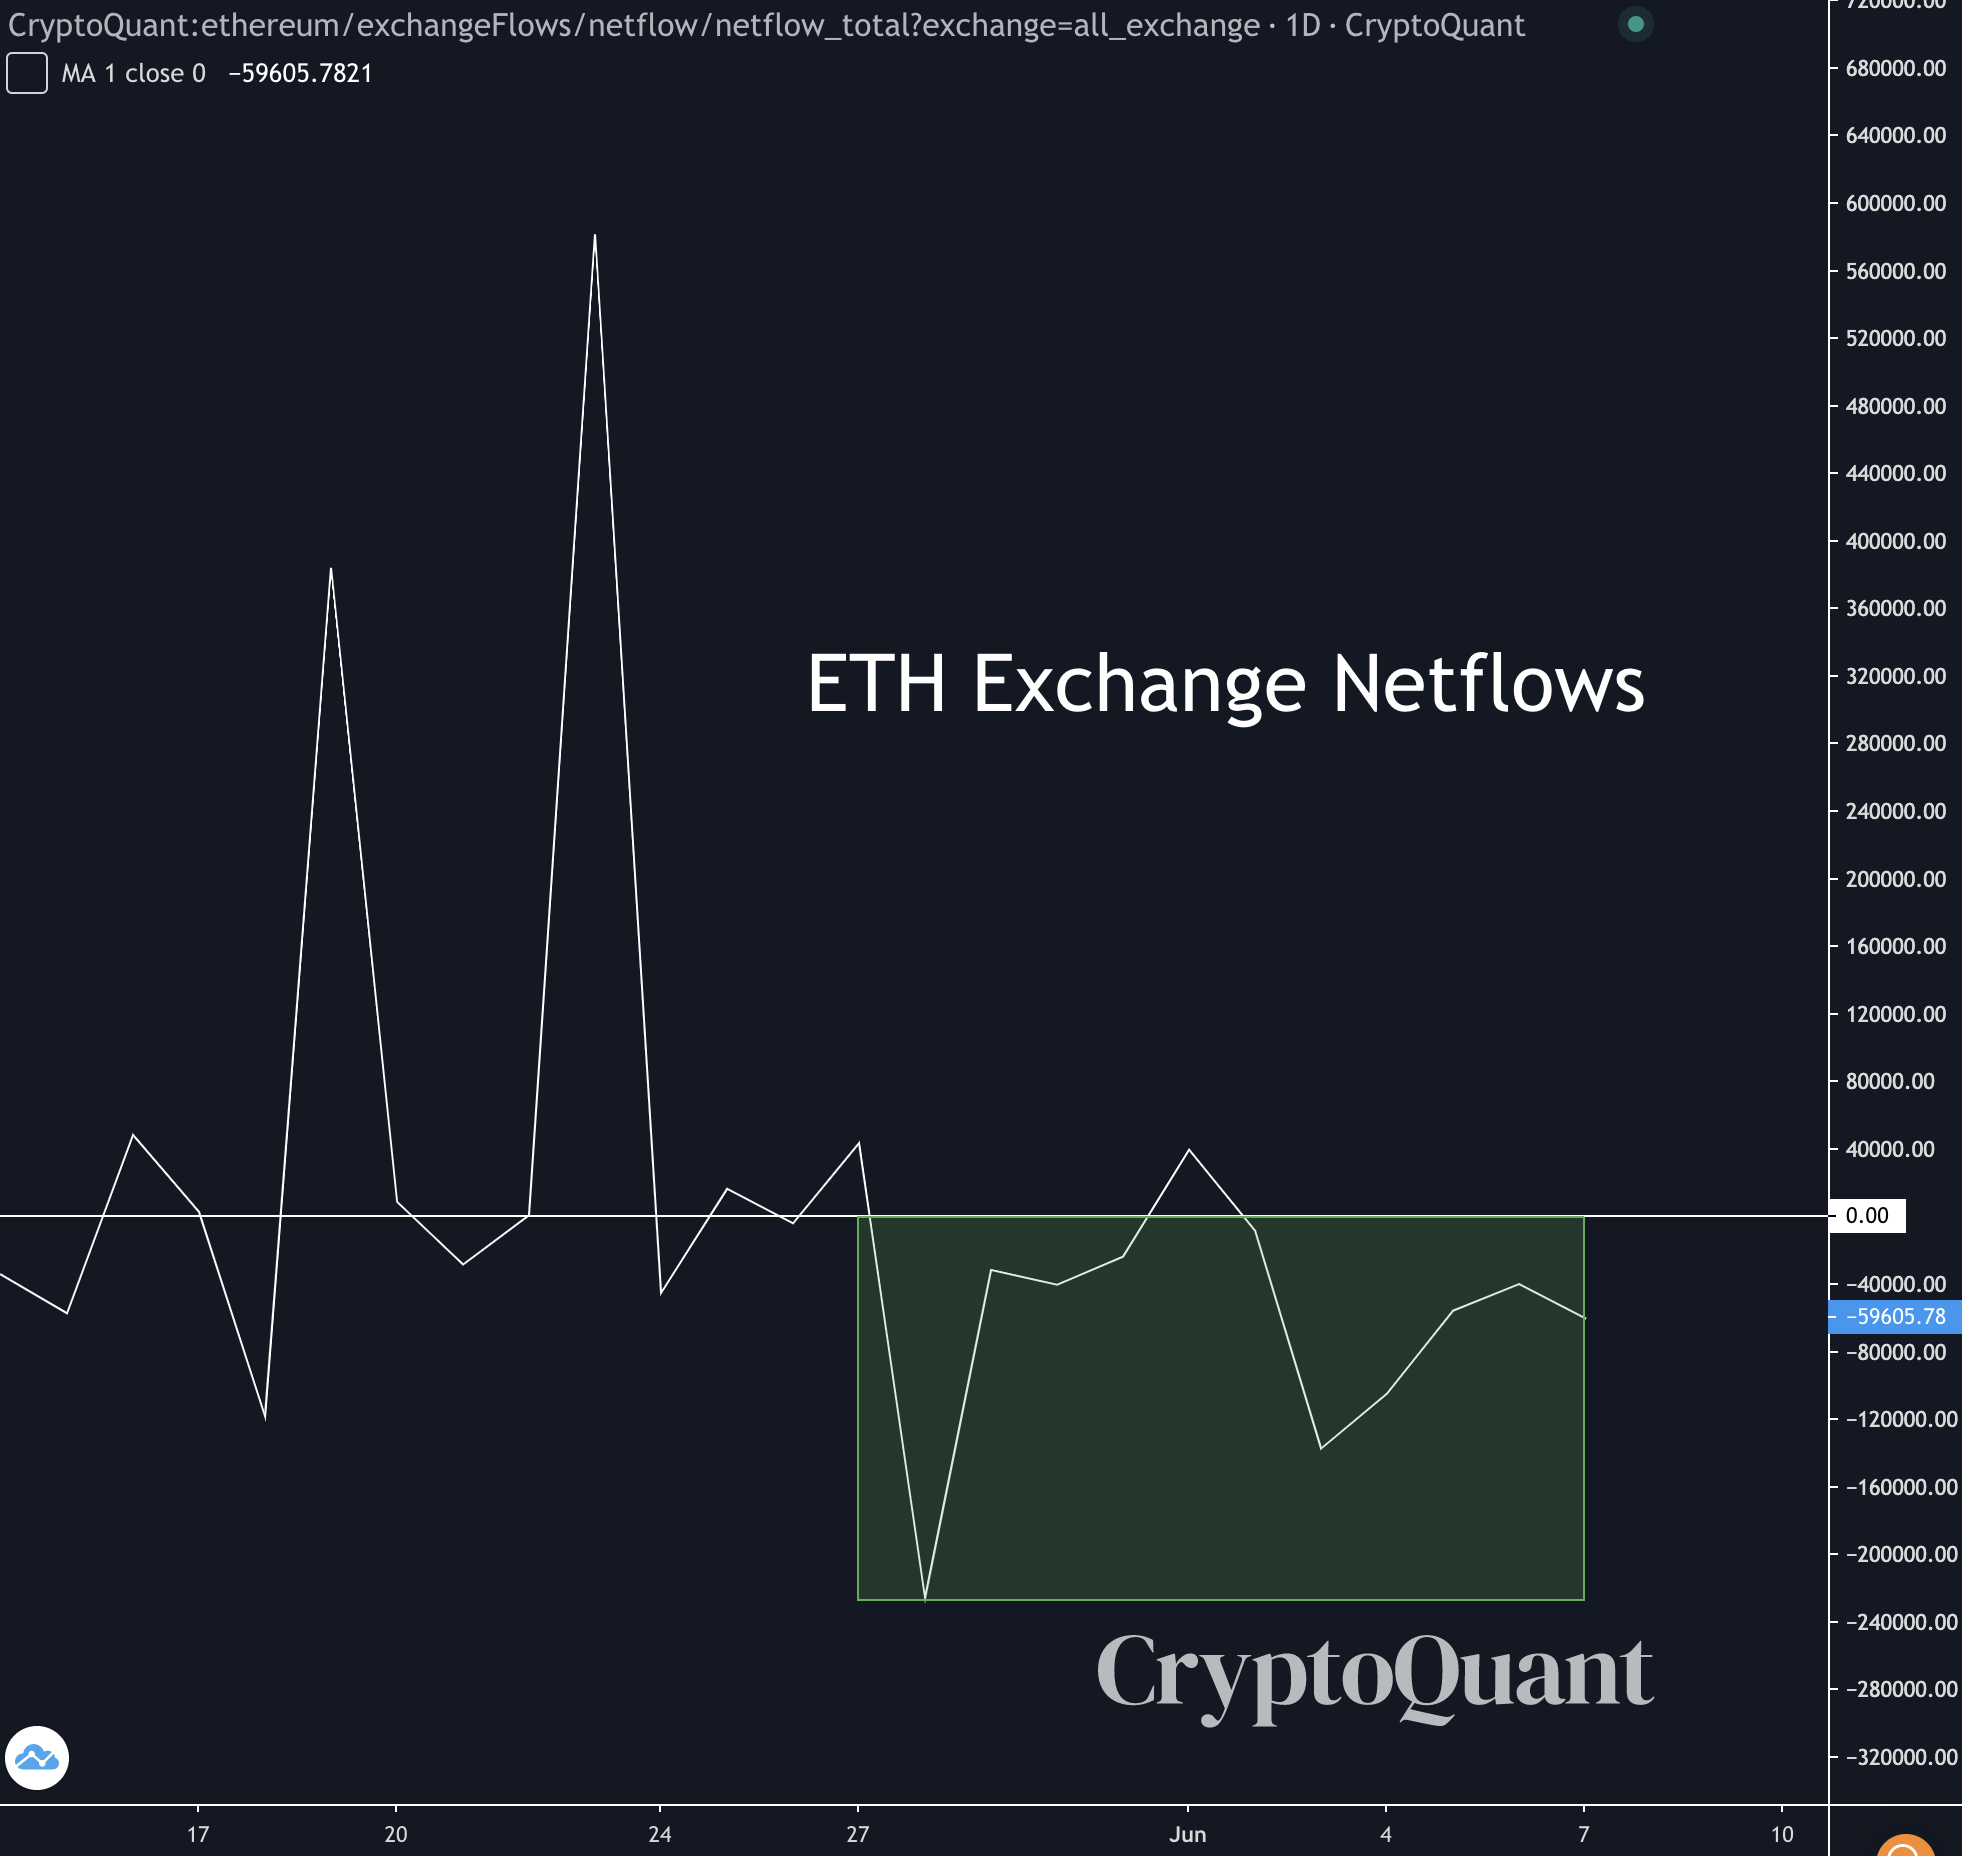
ETH was no different. Exchange reserves have dropped by 704k ETH since May 27th. And ETH netflows from CryptoQuant support the steady negative readings we see on our end as well.
If I’m a trader looking at onchain flows, this is as bullish as can be.
We’re near support with solid multi-day negative netflows, El Salvador views bitcoin as legal tender, and MicroStrategy is about to load up on more bitcoin.
The possible entry point near $35k looks like and feels like a steal.
But diving into the onchain flows a bit more, we can see this might be our bias forming our opinions. And the reality of the situation is we are no closer to having clarity or momentum on the market.
I know, it’s almost a bit depressing to think. But let’s not let our long-term UpOnly bias cloud our minds in the near term.
Here are two charts that best sum up what we mean…
Kraken witnessed about 16k BTC exit their exchange on net over the last few days. Glassnode recorded a bit more on their end, so this doesn’t appear to be any data anomaly.
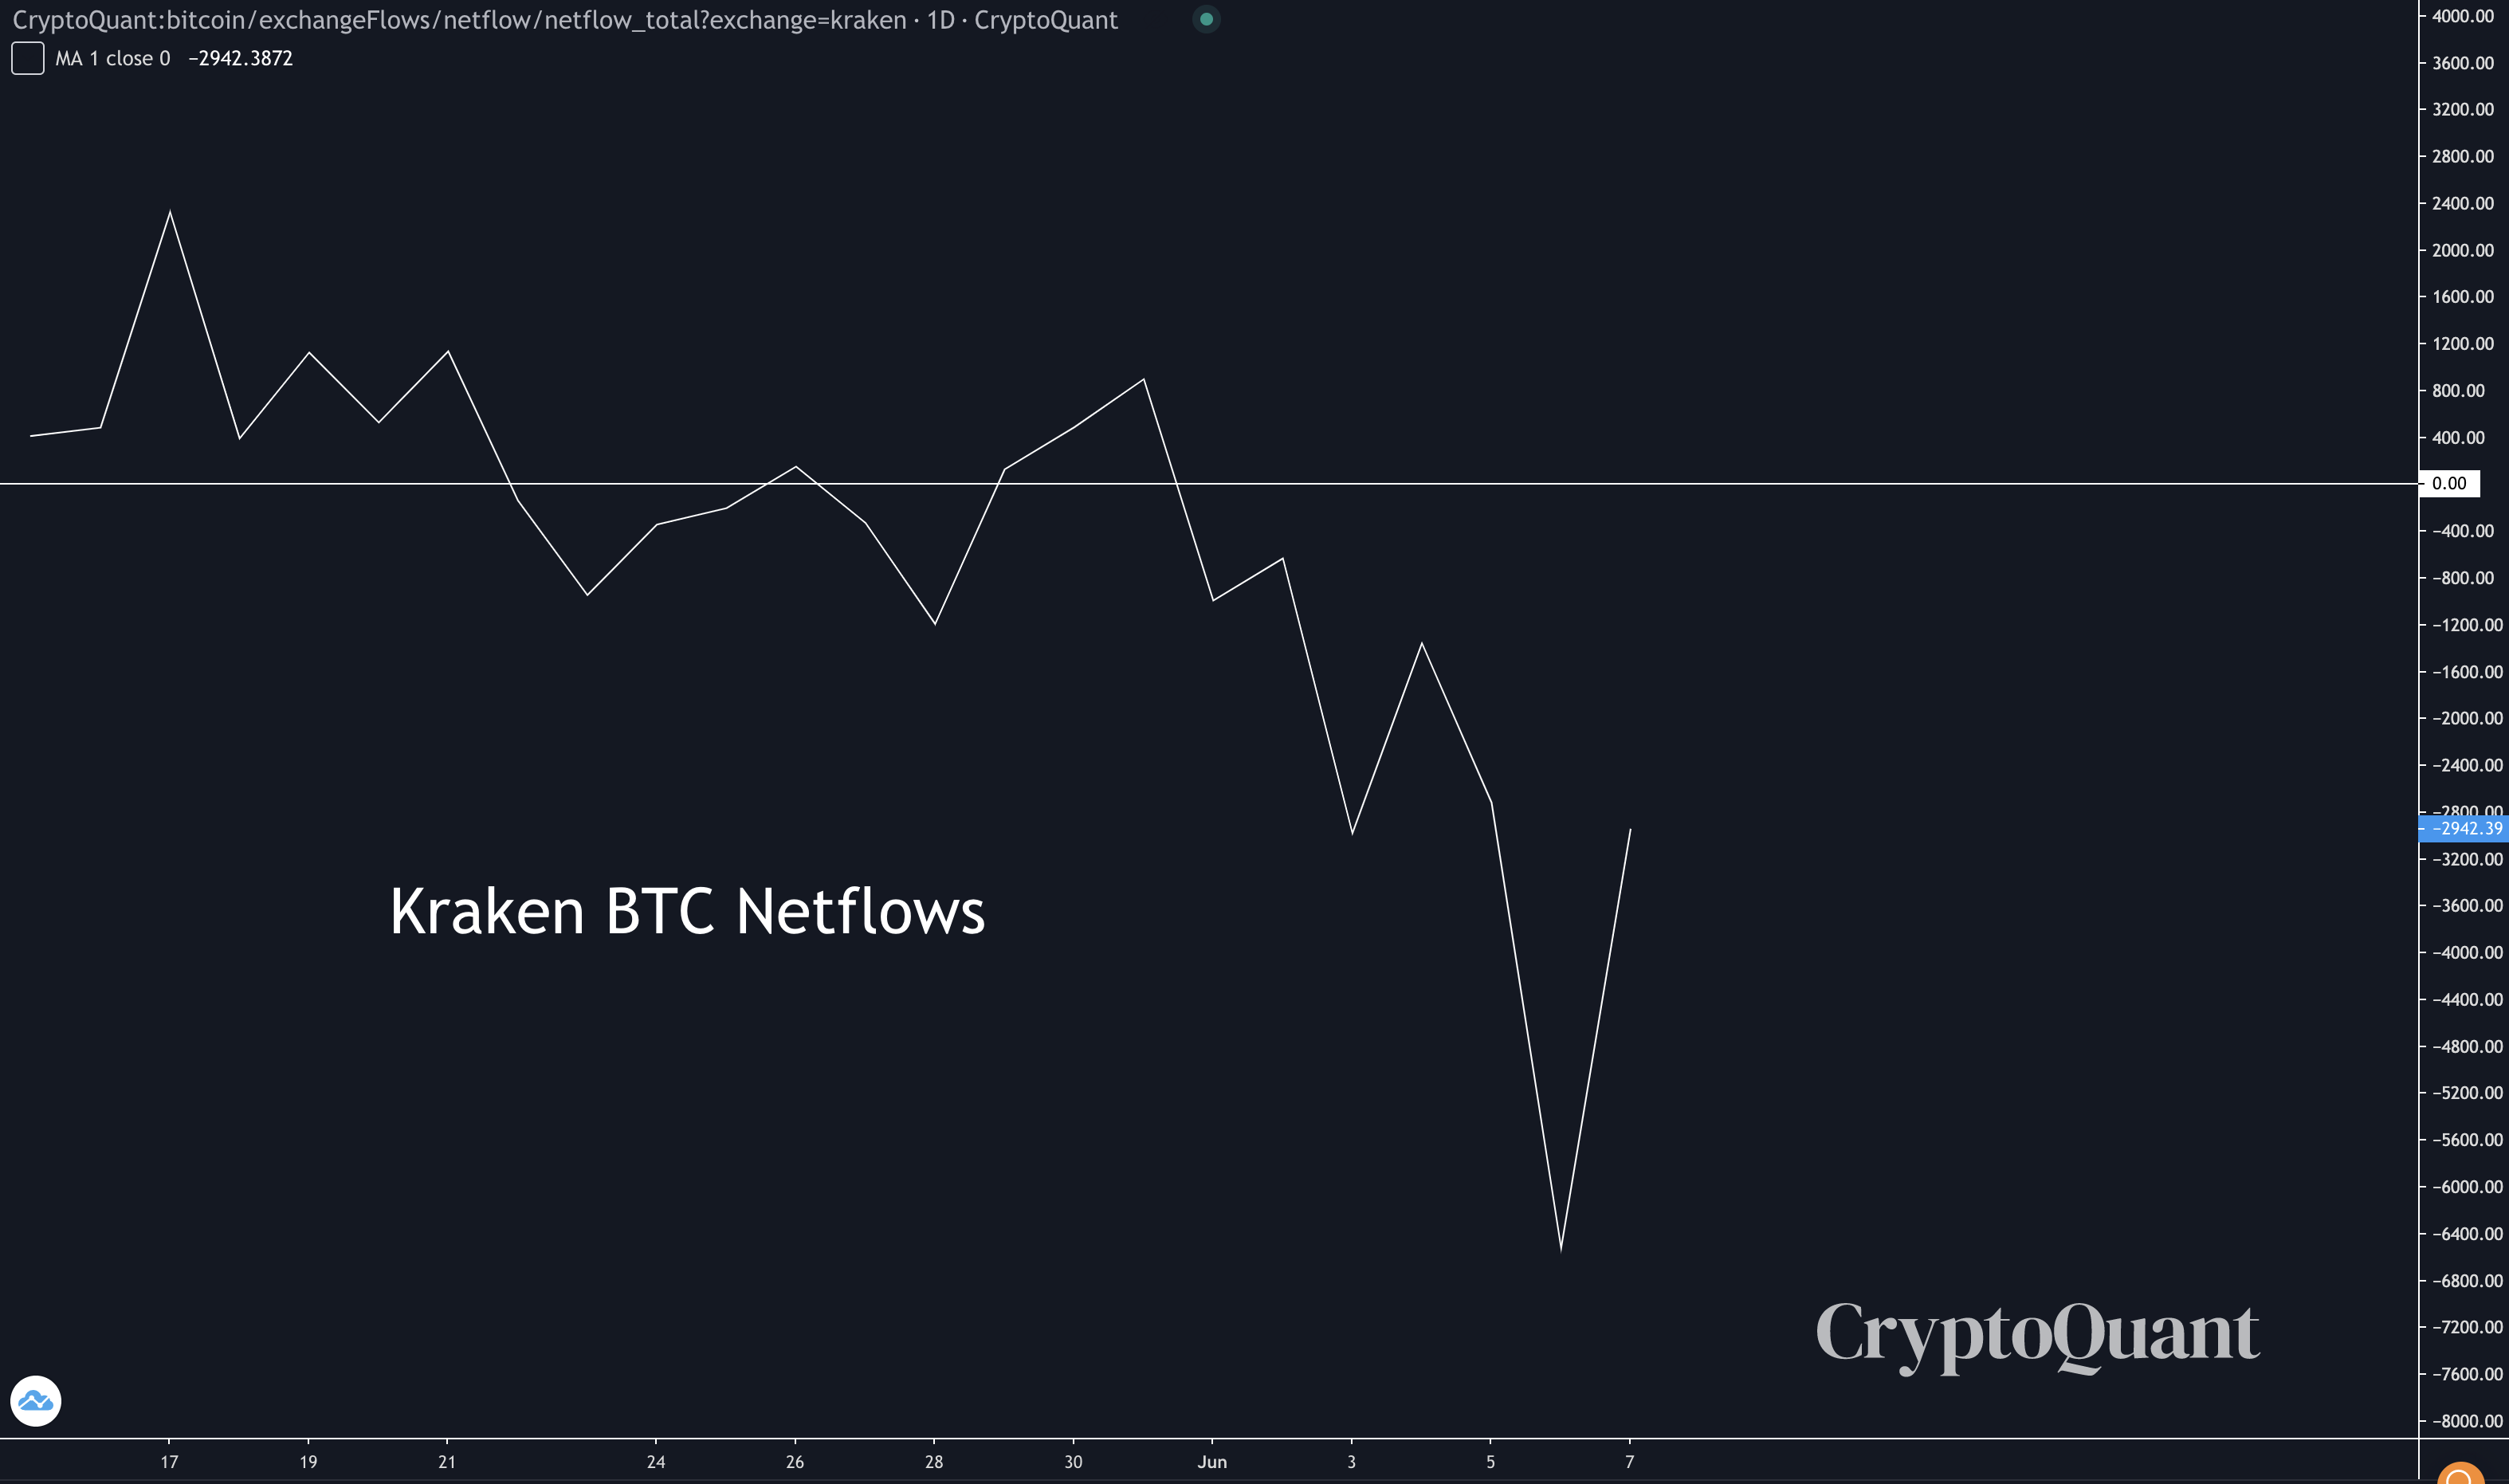
Kraken is not an exchange where traders go to accumulate. There simply is not enough liquidity there. Coinbase, Bitfinex, and Binance are the go to exchanges. Then there are a handful of next level exchanges before one considers Kraken.
The second chart is Huobi’s netflows. This exchange saw a significant outflow after the China ban last month. The exodus is continuing, but a bit slower. It’s nothing to get too worried about as the average is floating around 1-2k per day, it’s simply something to make note and backs up what we see with Kraken.
These are not accumulation outflows taking place.
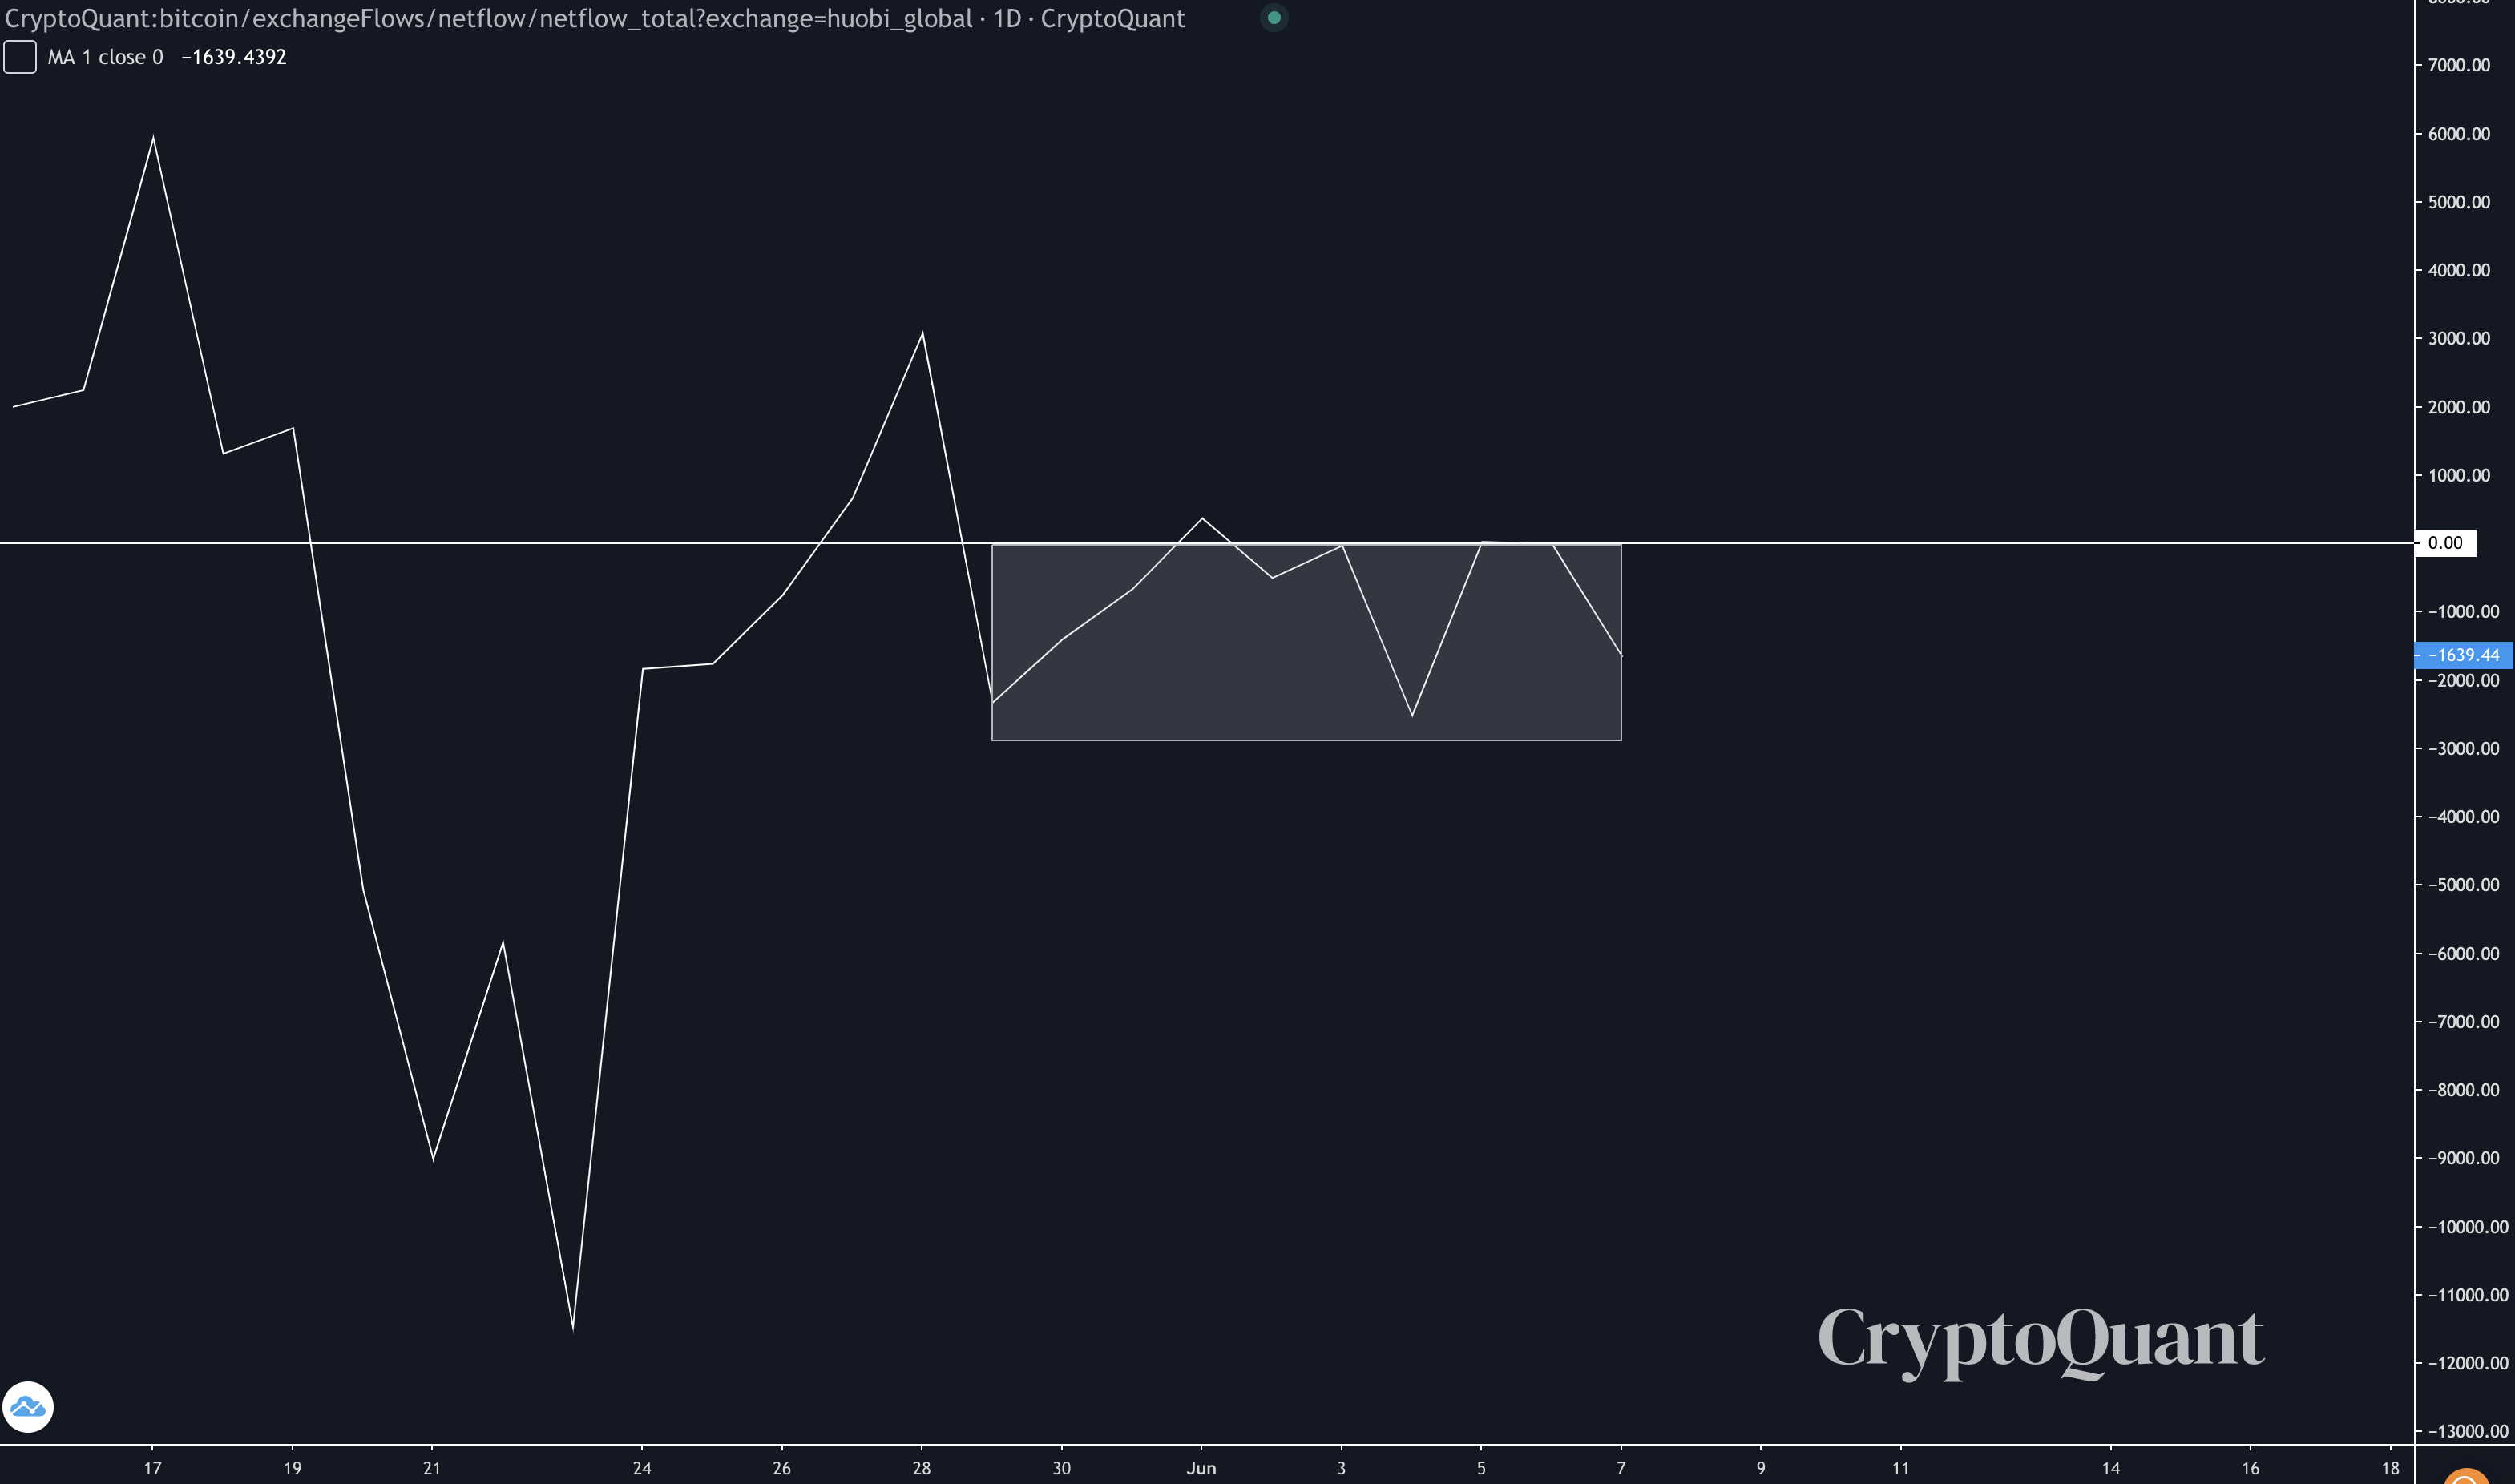
It’s more like bitcoin are getting shuffled around.
It appears Binance hasn’t received the bitcoin per their flows, and OTC desks are relatively dry per glassnode data.
Which gives us the feeling that a lot of this BTC will circle back into exchanges soon… Because again, these aren’t exchanges where you accumulate bitcoin in significant numbers.
And now that we reconsider what on the surface appears bullish, we end up slightly changing our perspective. Which is to say, right now many are looking at the above figures and seeing what they want to see, bullishness.
This slight change of perception helps us see the Pareidolia. Still don’t quite understand what I mean?
Do you see the Elephant in the photo below?

Now scroll back up to the top of this article and view the cover art at the top. It’s the same rock viewed with a slightly different perspective.
The Elephant is gone. Your mind sees what it wants to see, and with a simple change of perspective we can overcome the bias.
So to sum up today, exchange netflows are not as clear cut as they might seem. There is some accumulation taking place, but not enough to override the nearly 164k BTC that flooded the market, yet.
It’ll take some time. And with what’s going on as of late, we wouldn’t be surprised to see bitcoin at $32k-$30k or even lower.
(edit: this was written well before the price action that literally dipped into $33k, smh. We actually thought we had about 12 more hours before it unfolded.)
If we get it, then it be prepared for what might evolve into a quick “V” type of move. Something we’ve been hoping for. It could be exactly what’s needed for the market to gain momentum again.
Your Pulse on Crypto,
Ben Lilly
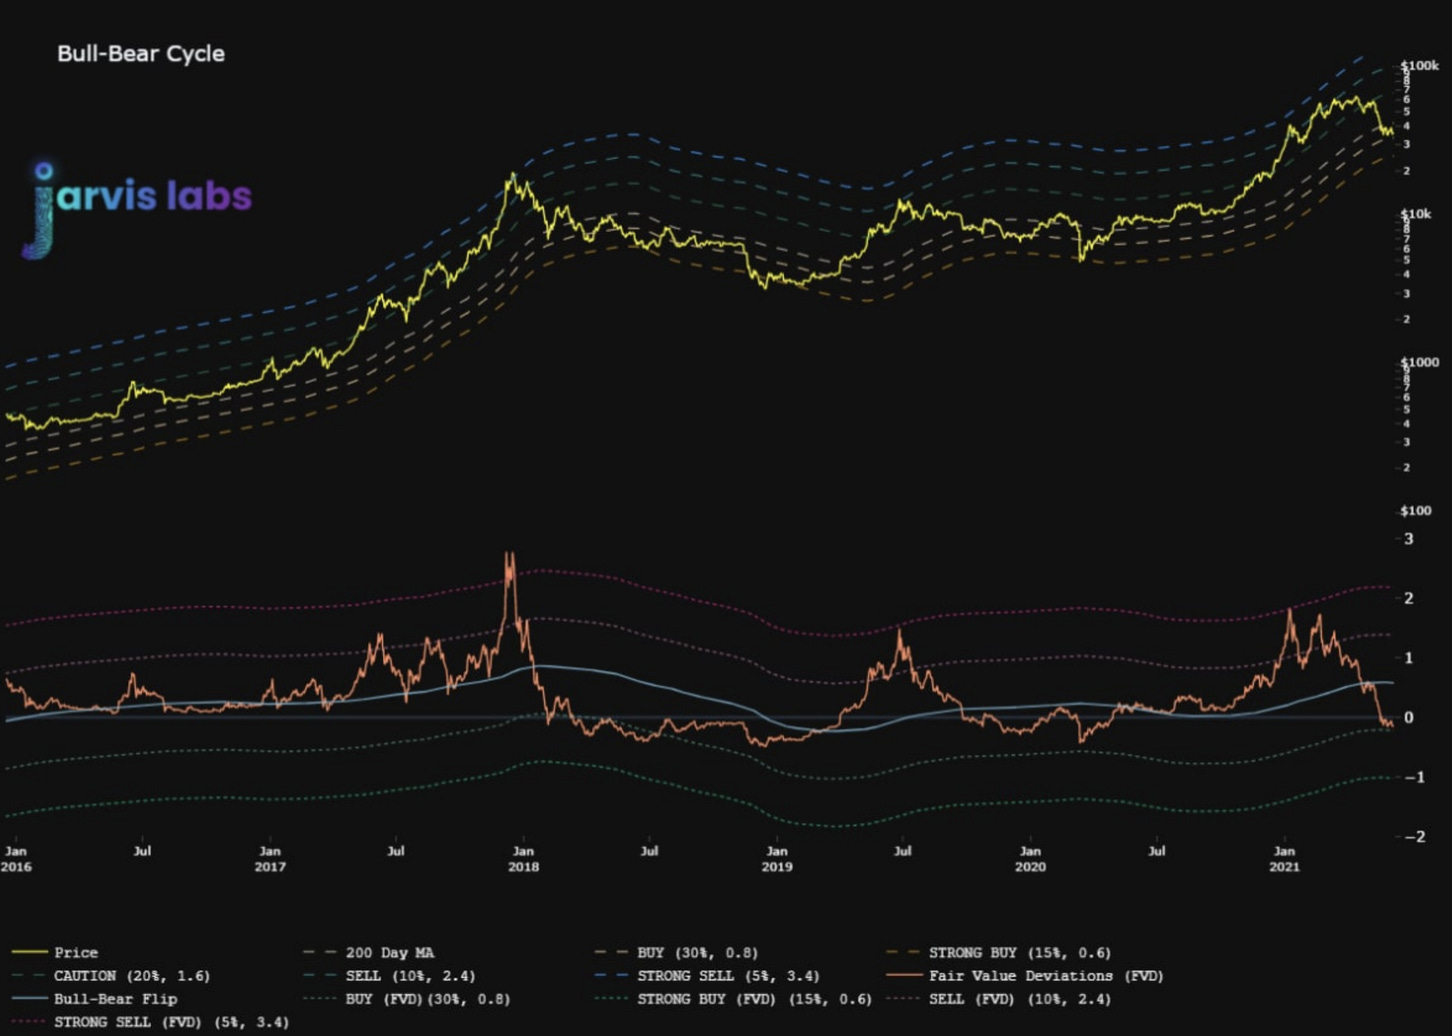
P.S.-Many of you asked for our bull/bear chart. Here it is, still in bear territory for now. The horizontal blue line on the bottom half of the chart is the bull/bear divide.
