Ominous REKTage
Here's what we know so far

A morning shot of on-chain and market insights in your inbox to start your day
Guiding a boat past the break is about timing.
You scout the waves rolling in. Each wave progresses from a distance hump to a barreling washer machine of energy before its soapy like whitewash rinses ashore.
Once the rhythm is apparent you hit the throttle. The twin engine plows the single hull through the whitewash with little resistance.
Your timing is excellent.
The wave before you crashes and provides you with an entry into the open ocean. You give the engine more...
The motor sputters to a halt and suddenly you’re unable to steer or power the boat. You’re at the mercy of the next wave as it towers overhead.
You’re position in the boat... it’s similar to what it would have been if you were long on leverage the moment the API went down on Binance and FTX. You’re left helpless and at the mercy of the cascading wall of water.
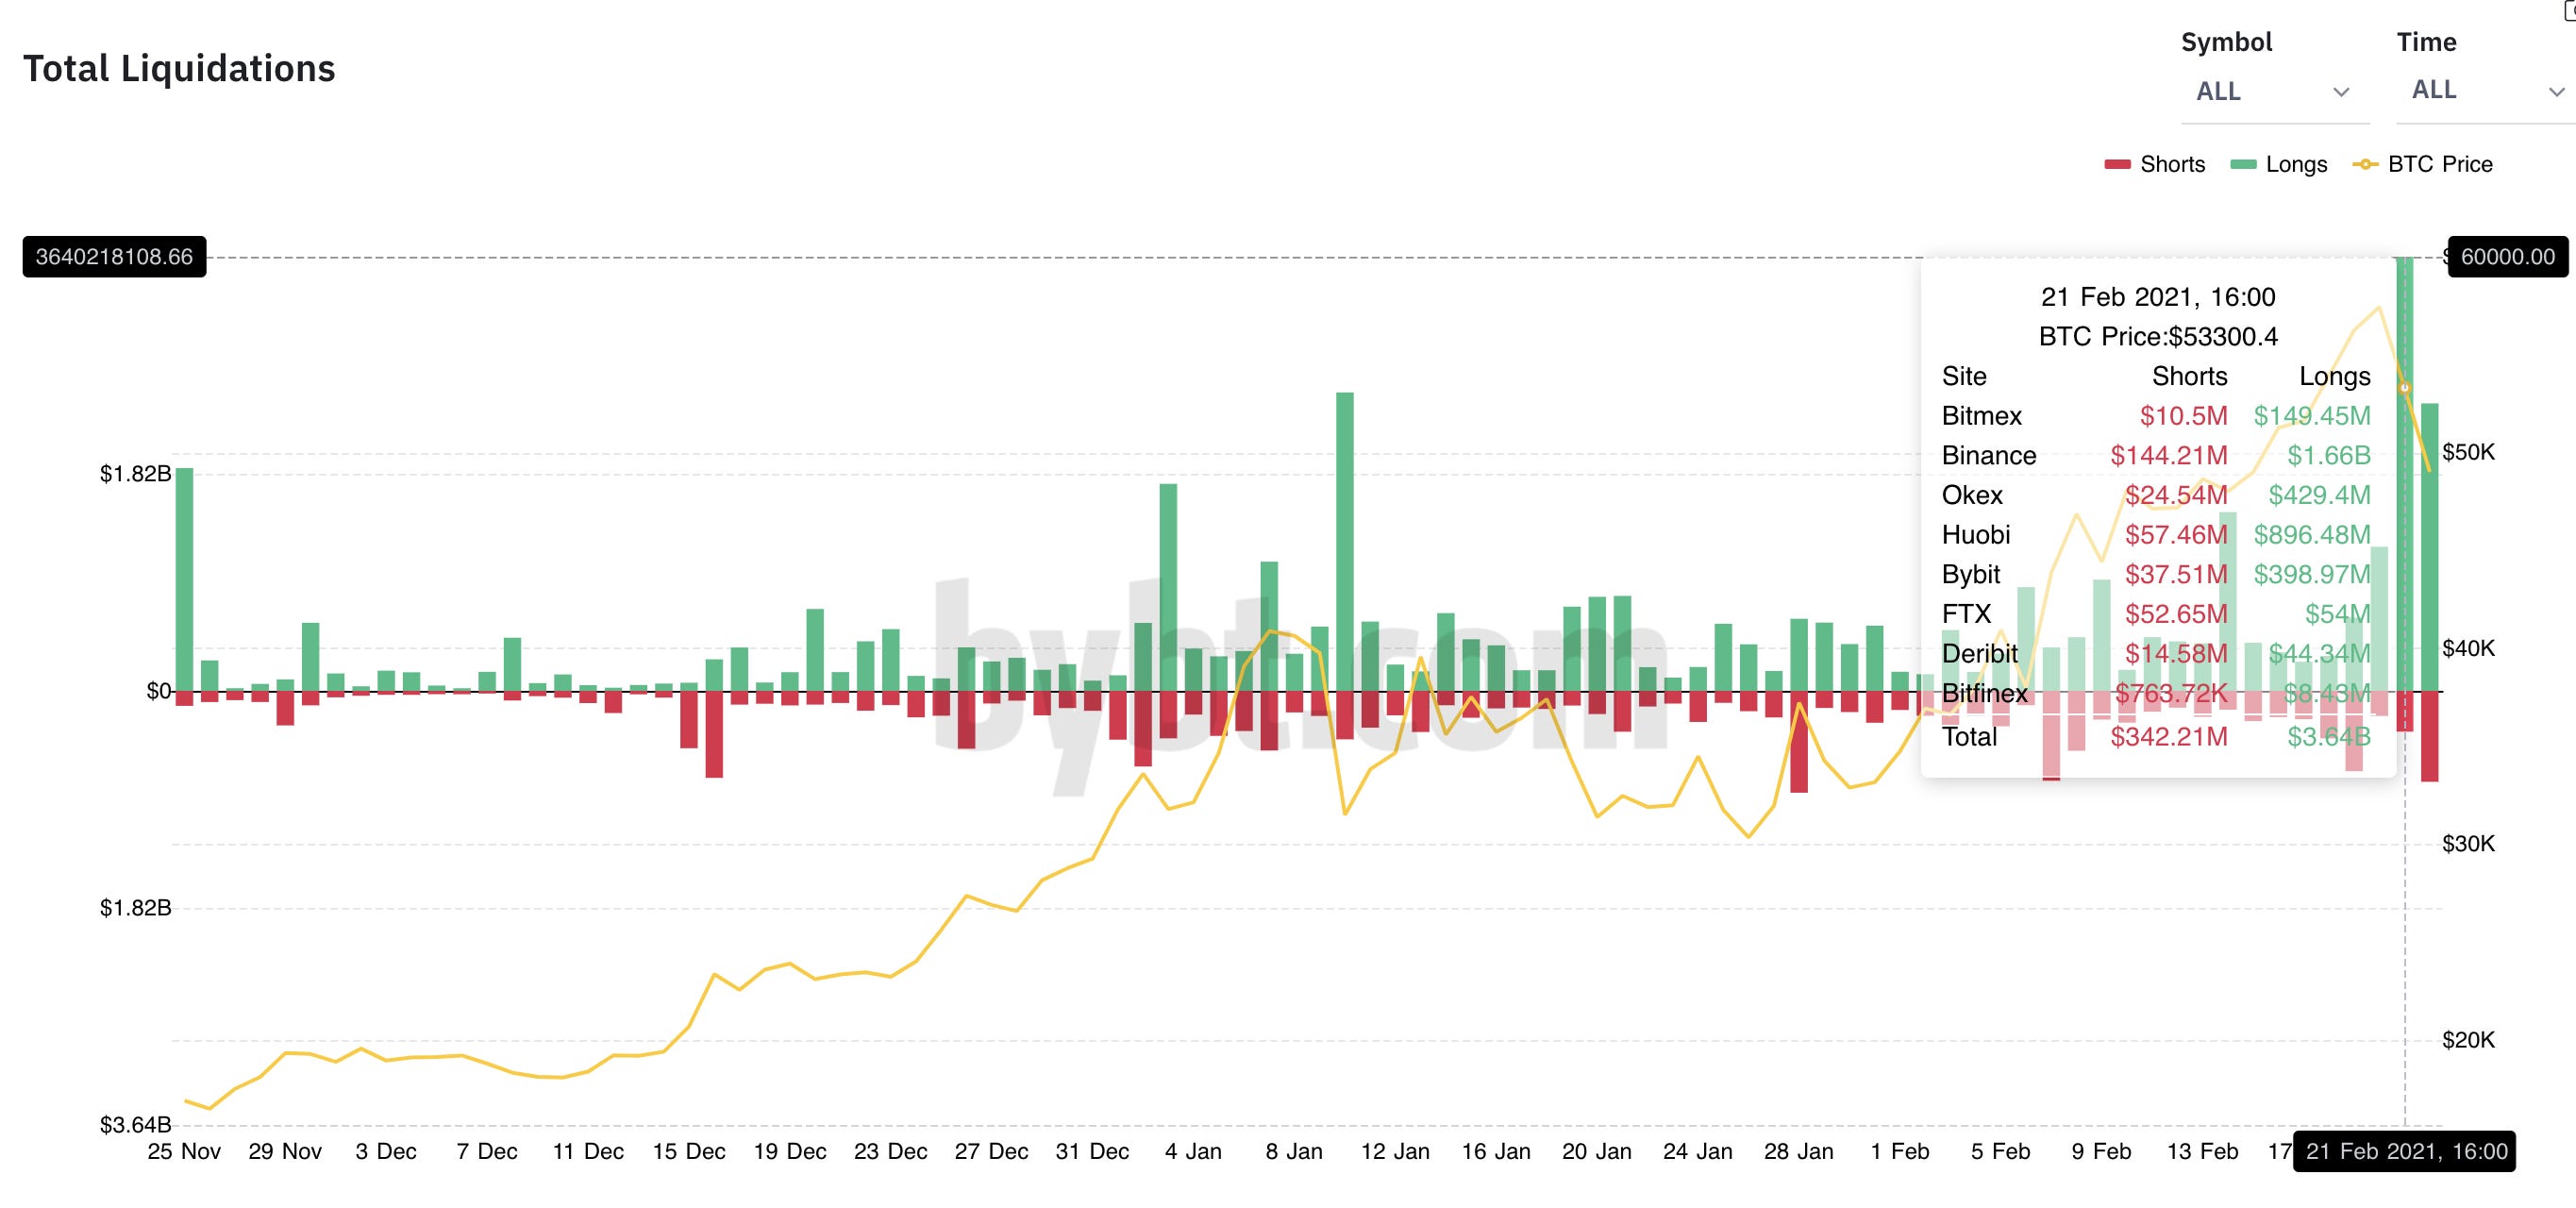
As you panic to no avail the impact wipes you out along with $3.6 billion worth of capital across major exchanges.
As you regain your footing there’s a lull in the waves. Turns out it was the moment you’ve been waiting weeks for. The perfect opening.
The price of BTC is down 9%, funding rates are the most attractive you’ve seen since you purchased your first COVID mask that matches an outfit last year, and your account is loaded with dry powder.
Yet, turning on the engines you still get silence. APIs are still down. Meanwhile, the largest boaters are moving out to the open ocean with ease.
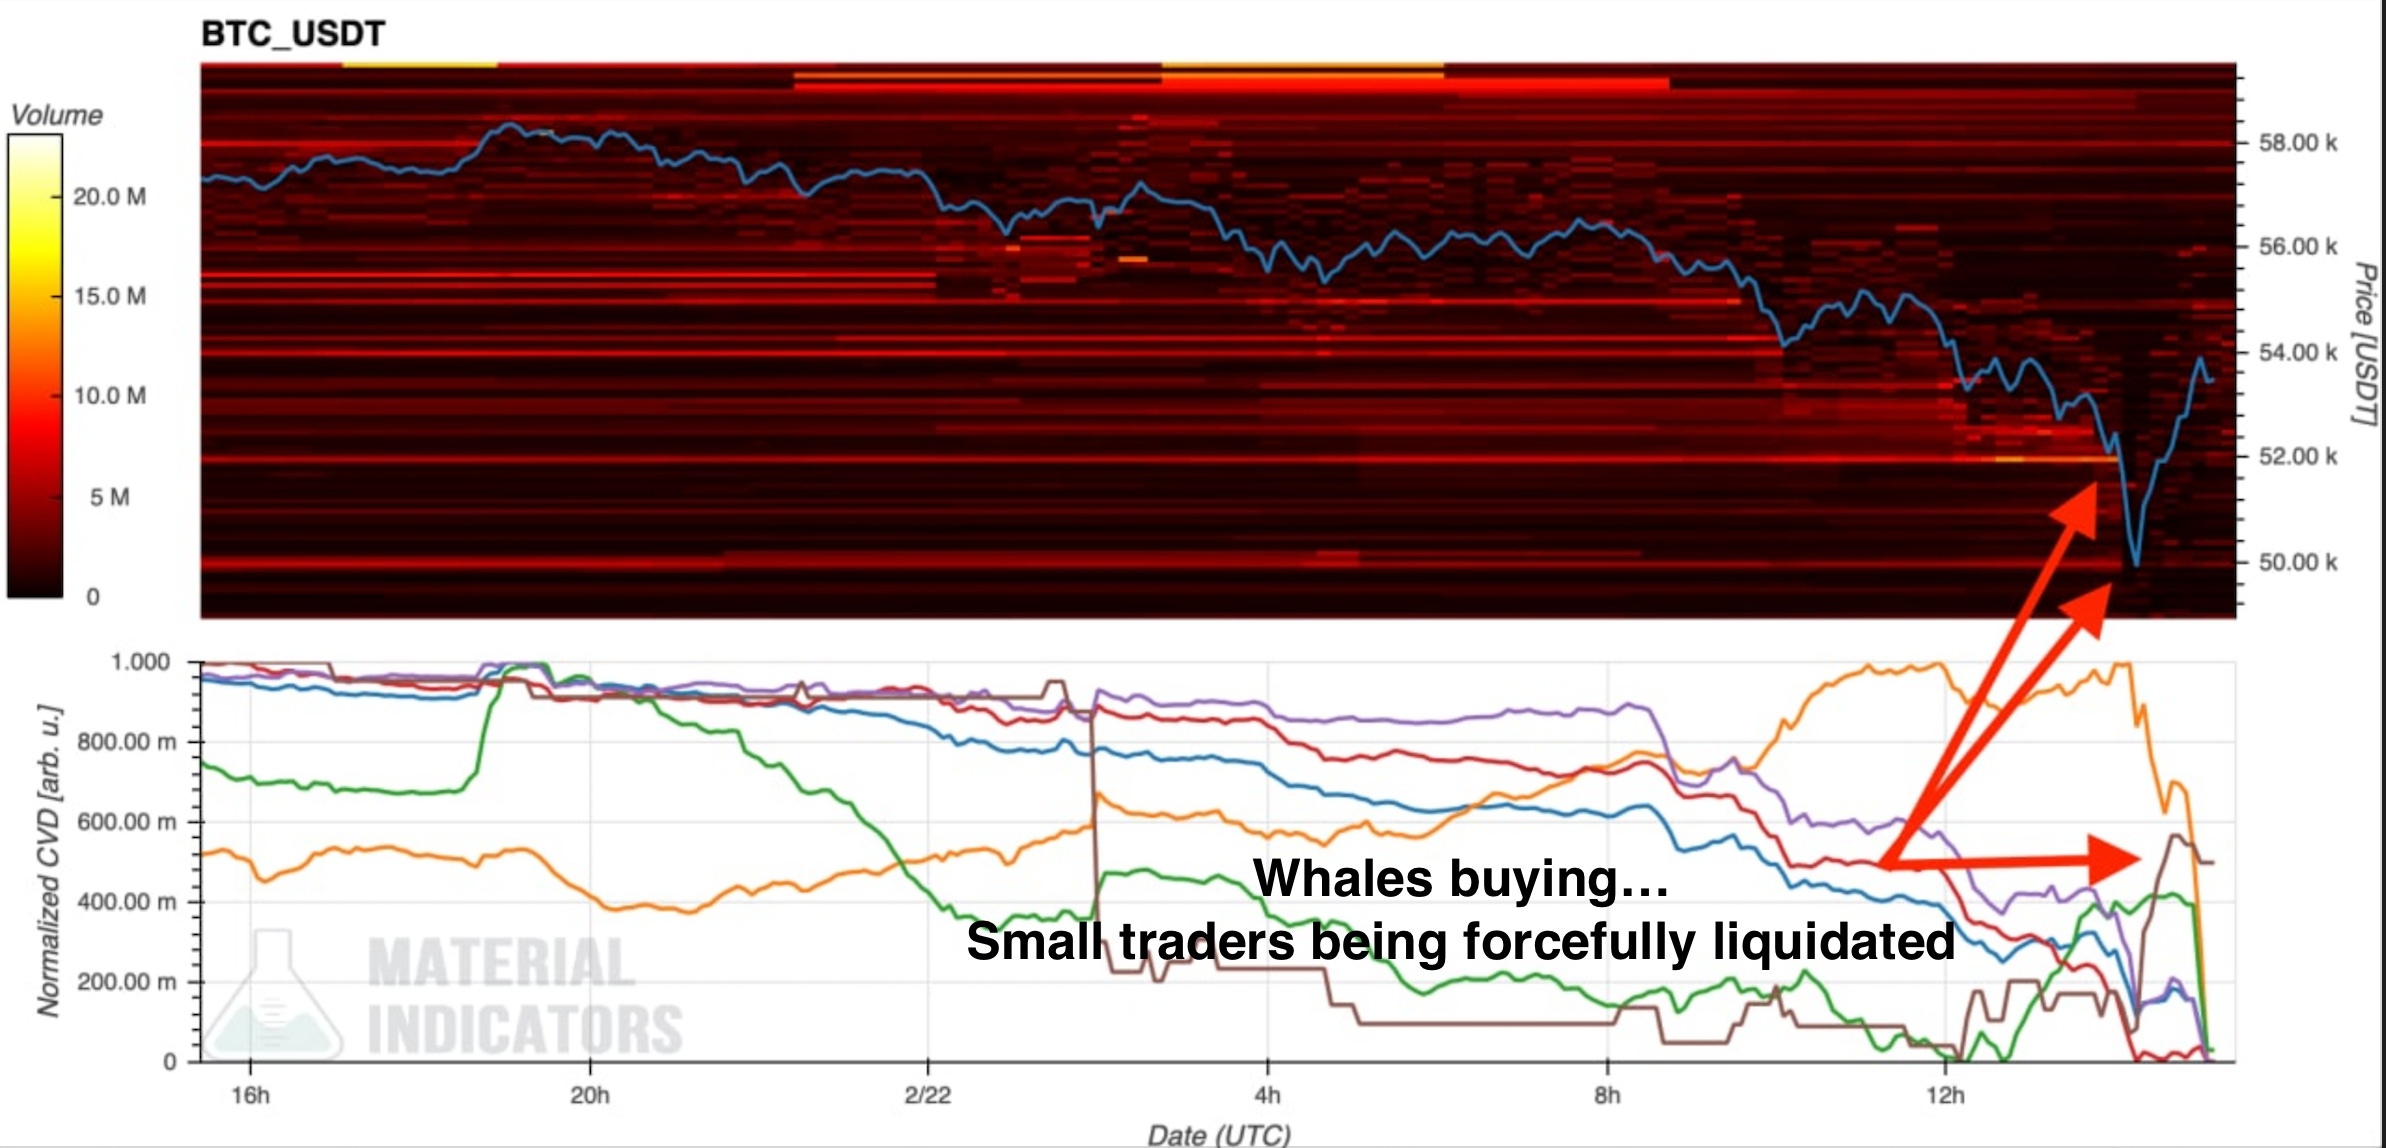
These were the whales of the market taking full advantage of the opening. In the chart below you can see they (brown line) were buying as smaller account were selling.
As you struggle to gain power you can’t help but feel bemused. How is this possible?
The answer isn’t clear, but the question is warranted. As the dust settles on the drop notable figures are pointing fingers at various entities for faulty tech or possible conspiracy like theories.
Instead of playing in the sandbox of accusations and assumptions, here’s what we do konw.
Binance (and FTX) went offline during “high traffic”… which happened before the price dropped. This issue caused buying support or the ability for traders to maintain adequate levels of margin to be barred from entry. Thus, removing a very important part of the market in times of immense selling.
Simultaneously while buyers were walled off, sell pressure from Coinbase pushed prices lower and lower. It’s seen in the discount in price from the chart below. Coinbase’s spot price is the orange line. The fact is dips lower during the selloff means its acting like an anchor on price since more selling is taking place.
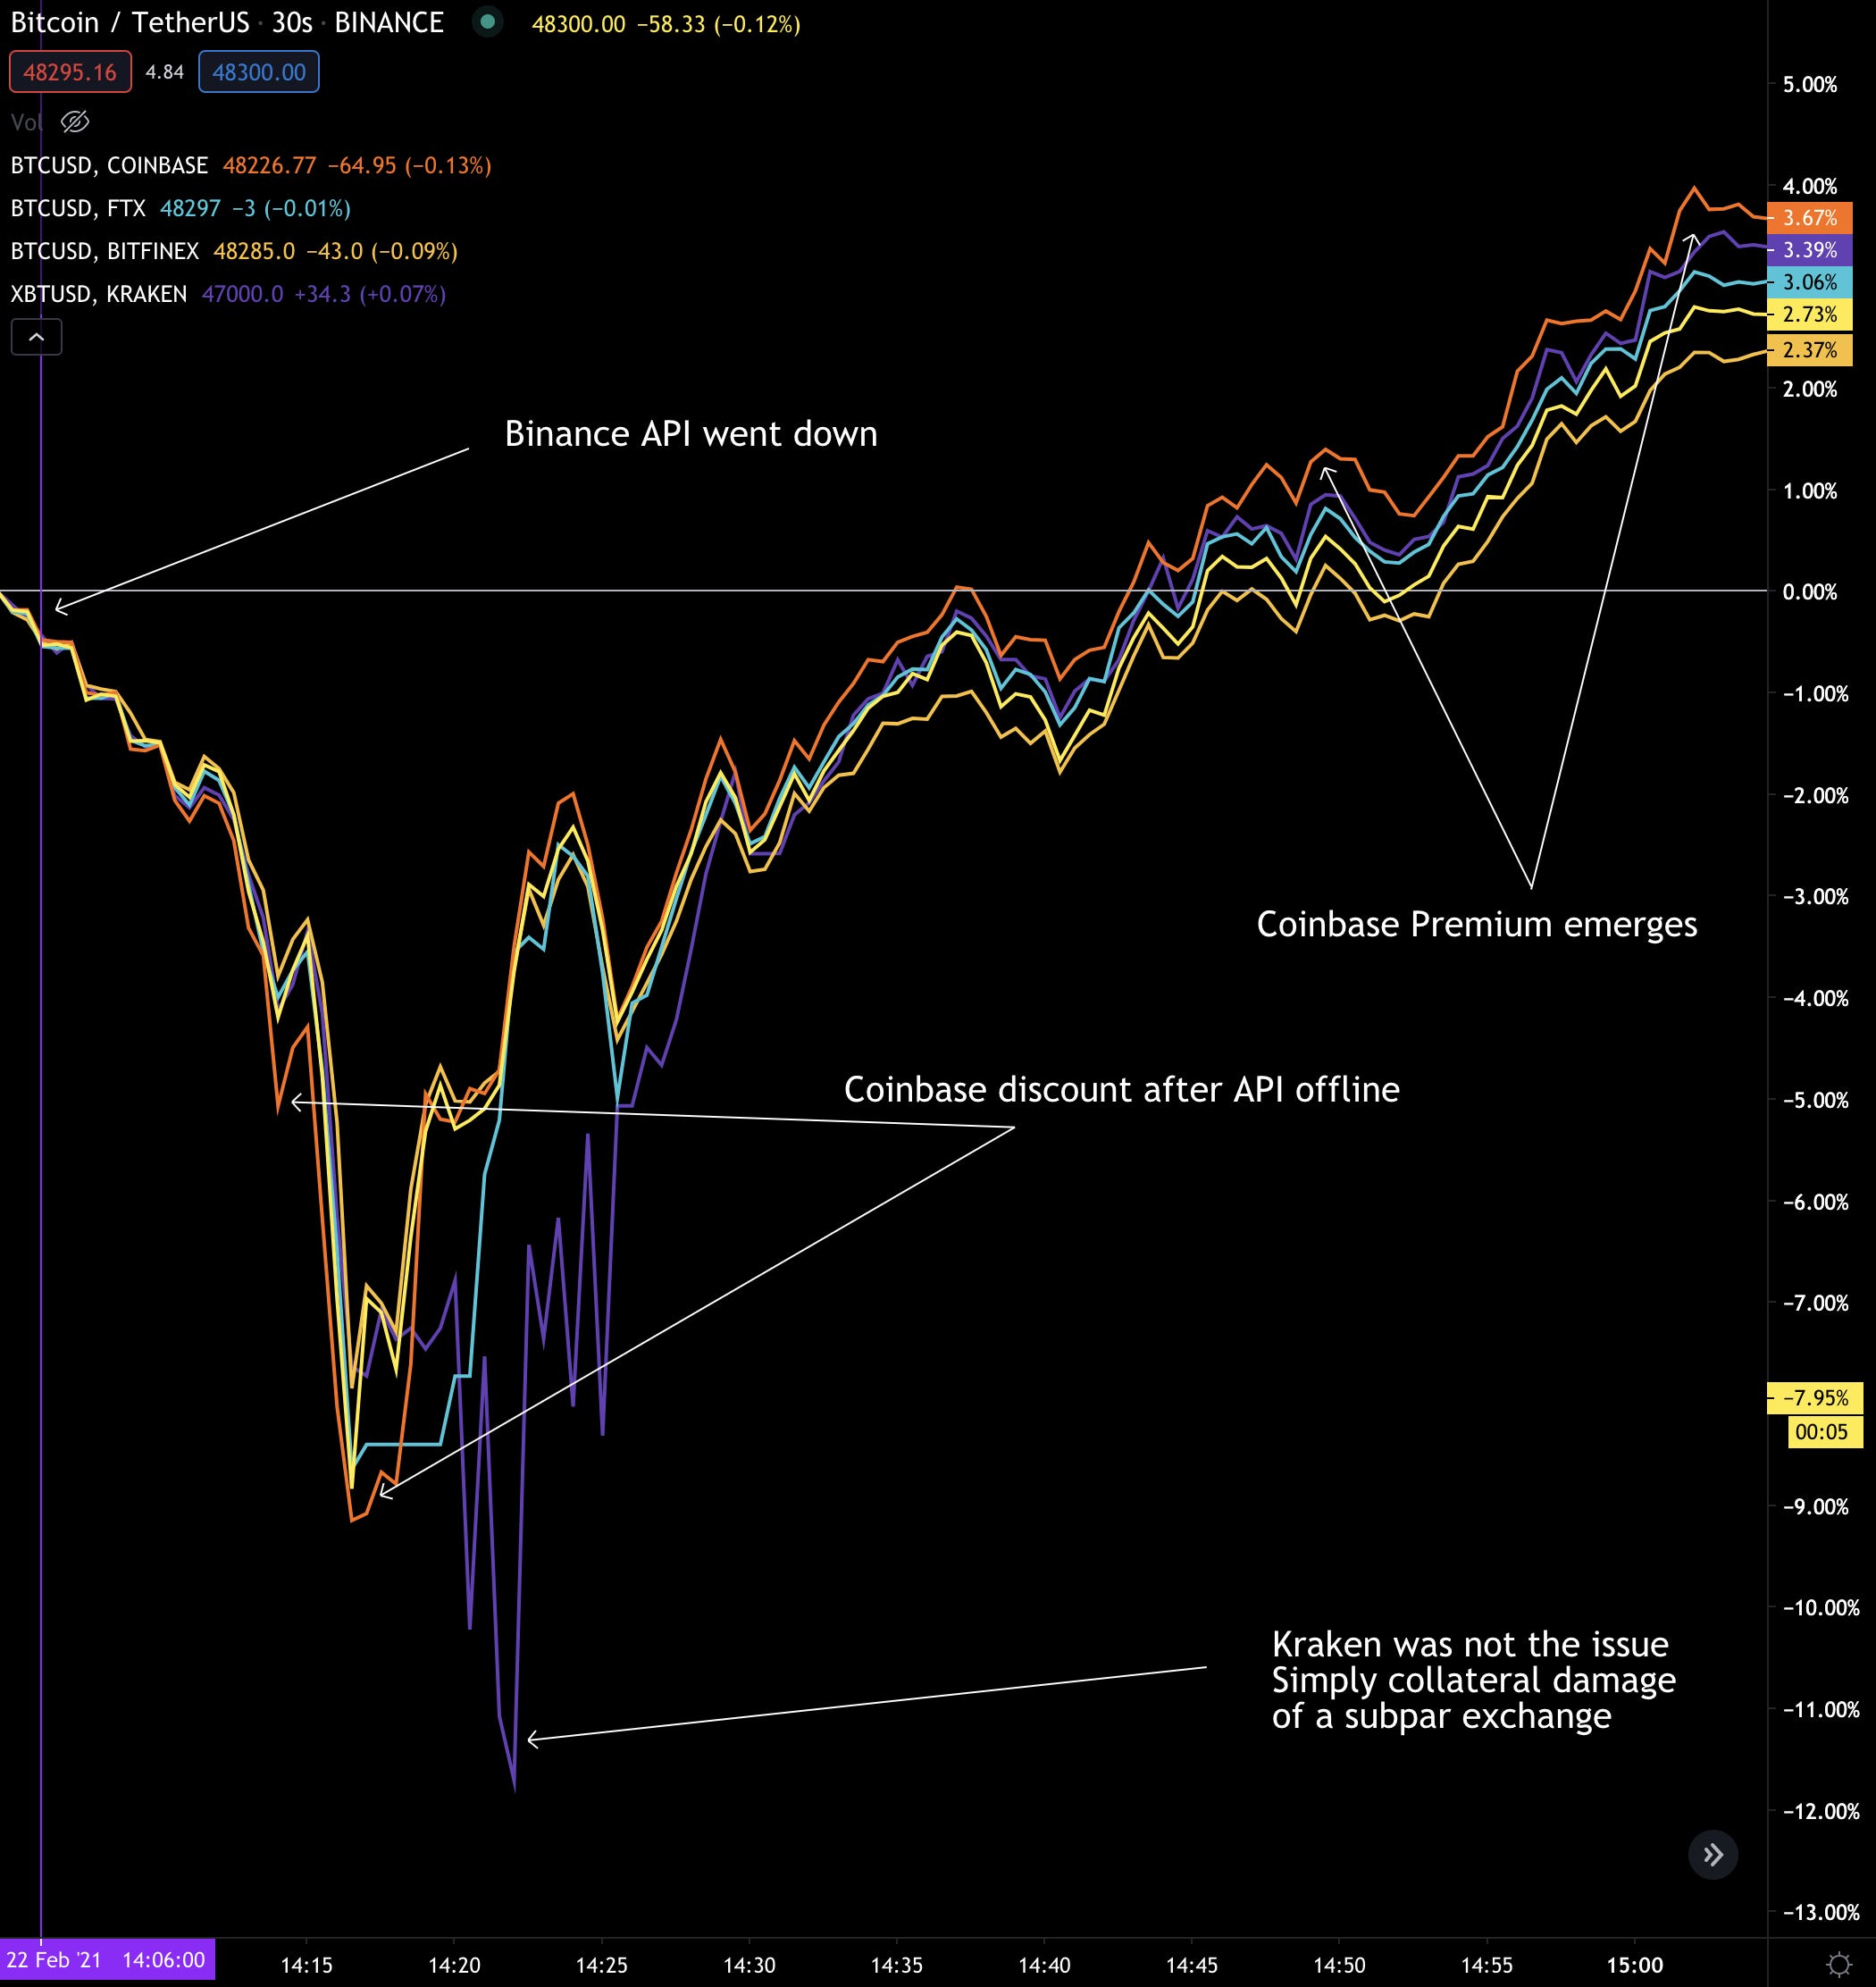
Then as price bottomed out this prior discount flipped and became a premium. Meaning buy pressure from the dip originated from the same exchange, and with greater intensity than other exchanges.
What’s important to note is the exchange where the majority of liquidations were happening did not result in lower prices than Coinbase. Keep in mind Coinbase doesn’t use the same highly leveraged derivatives that Binance does. And its these highly leveraged products that can create bigger fluctuations in price.
Yet, as we saw in the first chart, whales were the first ones to step up to buy on Binance… An exchange that saw their API and exchange become ineffective while this took place. Meaning it’s likely the trader purchasing bitcoin was able to bypass the technical issues and create enough buy support in the face of billions of dollars of liquidations to the point where Coinbase’s price, not Binance’s price, traded at a discount.
Bit odd.
So what happened here? Did the same entity that pushed prices down on Coinbase act on Binance to buy up BTC at a discount while the little guy sat idle on the sidelines reading their liquidation e-mail from Binance? And perhaps contribute to technical issues?
Keep in mind we saw no issues with AWS servers at the time.
OR was there billions of dollars on the line for one exchange to look superior to the rest prior to going public.
These are musings… With more hours in the day or resources at my disposal maybe more evidence could be uncovered. Regardless, what happened this week was not merely an “oops, high traffic” moment.
The game in crypto is played at a level most aren’t aware of.
Case in point is the crash in crypto markets back in March 2020… Did you know Ethereum’s network was attacked as prices plunged? And as they bottomed there was purposeful and aggressive suppression while attackers essentially robbed MakerDAO’s ETH vaults for $0 bids? Here’s an article in case you’re interested. It leaves out the suppression, so you’ll need to take my word on that one as I witnessed it live.
In crypto “putting a trade on” isn’t confined to one market or a set of tools or even a direction. It can include exploits, price feed manipulation, order book tactics, hackers, ddos attacks, and things we haven’t even dreamed of… Or maybe aren’t even aware of yet.
The manners in which money is made is multi-dimensional in crypto.
So what’s the point of talking about it? To let you know it happens. Crypto is still young, and many liken it to the Wild West still. And while it’s much tamer than it was in years past, risk management needs to be your priority.
Whether it’s protecting your private keys, using two factor authentication, trusting somebody online or using stop-losses… More thought should go towards minimizing risk.
And whatever you do or whomever you conduct business with, regardless if you trust or don’t trust them/it, always verify.
Your pulse on crypto,
B
p.s. - If you hear us talk about a USDT minting event, it’s very bullish. In fact, what we wrote on Monday still stands. The mint would be a very near term catalyst.
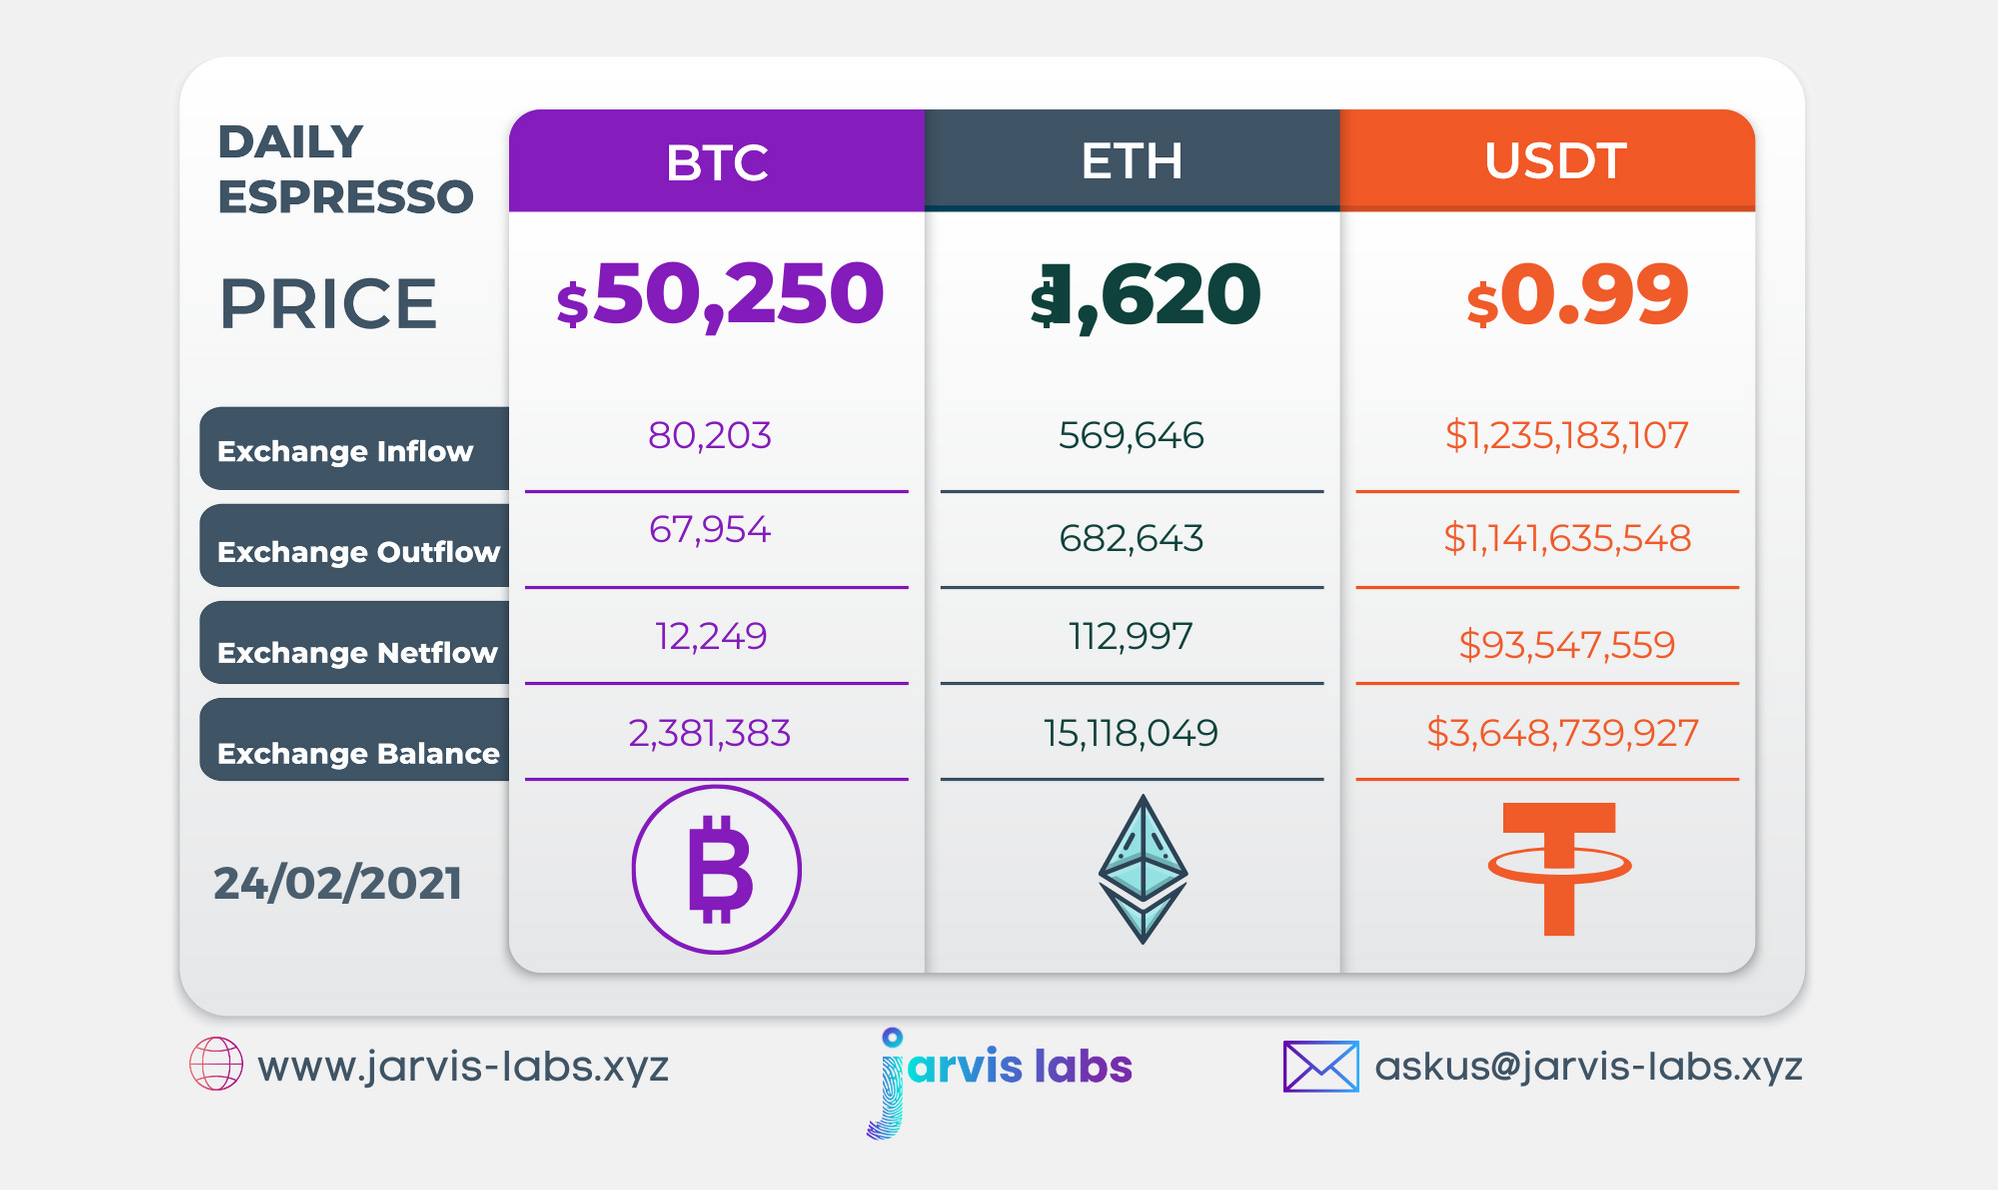
Below is our daily exchange flow data. This is a great gauge for understanding if BTC, ETH and USDT are flowing into exchange or leaving. If BTC and ETH are entering exchanges it can generally be viewed as bearish. The opposite scenario is bullish.
When USDT is flowing into exchanges it’s typically viewed as bullish. The opposite scenario is bearish.
This should only be used as a general gauge. Tagging the exact wallets these flows move into or out of helps improve the reliability of this data, which is what we do at Jarvis Labs. To date we have over 800 market mover wallets and 16 million wallets tagged all together. Consider us your on-chain trackers.