Midterm Miracle
Macro Update: How the Market Reacts to Elections


Before we get to today’s post, I wanted to share a short message.
Last Friday was Veterans Day here in the U.S.
As I am typing this update, I just want to send my sincere appreciation to everyone currently serving in the military and the veterans.
Regardless of anyone’s political opinions or party, we have a group of people who are sacrificing themselves to serve and defend the country for the purpose they believe in.
To these individuals: Thank you!
Now, onto today’s topic…
It’s that time of the month again: The Consumer Price Index (CPI) print, which gives us the latest measure of inflation, came out last Thursday.
It showed that in October, prices rose 7.7% from a year ago. That was lower than the expected 8% figure. And even that estimate is lower than prior CPI prints dating back to February of this year.
This signaled the popular belief that inflation may have finally started to slow down.
And like clockwork, the markets rallied, with the S&P 500 climbing 5.5% on Thursday. Investors think the inflation beast is tamed and an economic recession is just around the corner, so they’re anticipating the Federal Reserve (FED) may either pause its interest rate hikes, if not reverse its policy and start cutting rates.
In another word: Hope.
The markets rallied based on hope.
But unlike earnings reports or other empirical economic data, hope is not exactly a bulletproof metric that can provide plausible reasons for the market to reverse its trend and economic outlook.
However, a recent event might provide a window for us to look into the past to determine the future and predict how the market will perform over the next year.
The U.S. midterm elections.
Midterm Miracle
Midterm elections in the U.S. offer the people a chance to change the direction of the country and voice their approval or discontent. It gives the population an opportunity to show the incumbents their report card via one action: voting.
At time of writing, some of the races are still being decided. While Democrats will keep control of the Senate, the House is still up for grabs, although Republicans have a slim lead.
But depending on what happens, how will financial markets react based on what we’ve seen in the past?
Do they plummet when there’s a pervasive change in the Senate and the House that will provide a new direction?
Or do they soar higher when the country keeps the status quo, which will provide stability and ensure existing policies continue?
Apparently, the market does not care what the outcome is. Please look at the chart below.
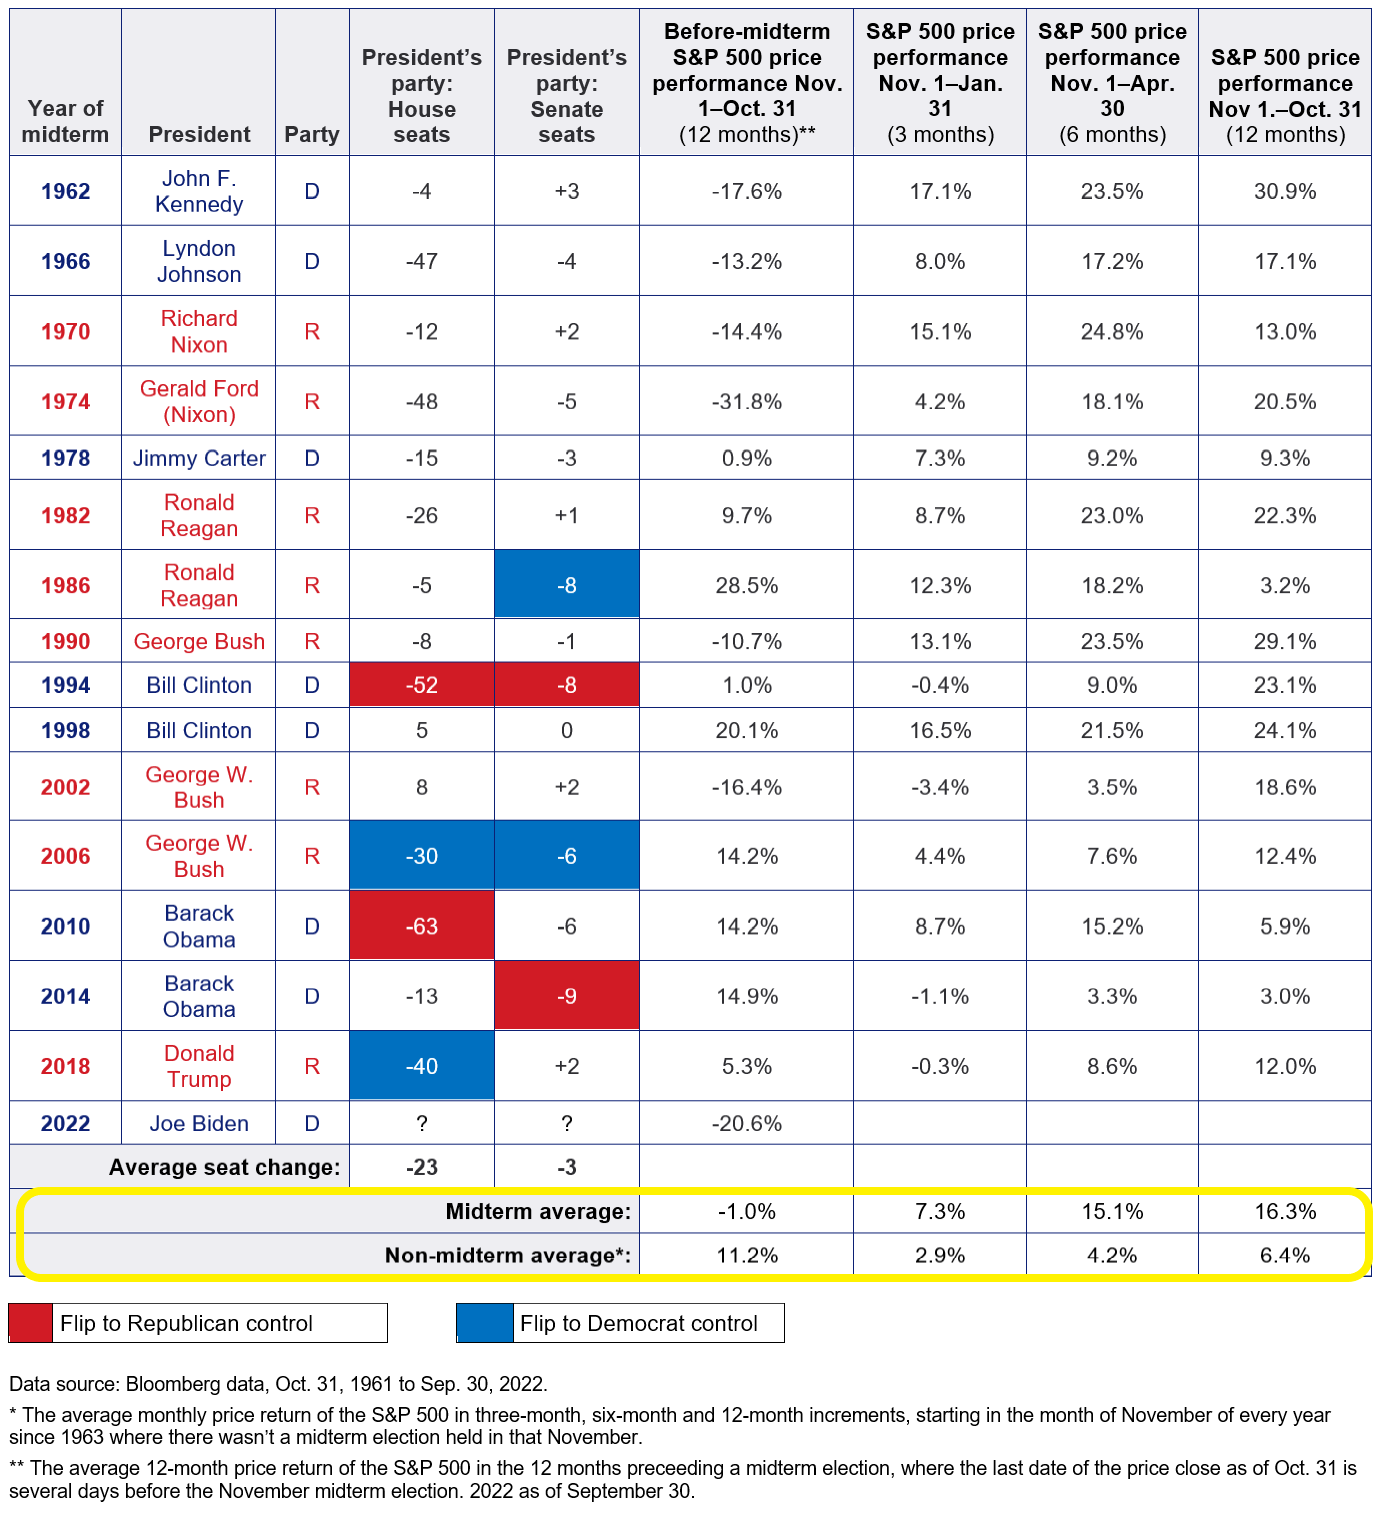
It turns out the market loves the midterm elections, regardless of the outcome.
Since 1962, the S&P 500 has performed better on average in both the 6-month and 12-month periods after midterms compared to the 12 months leading up to the elections.
Plus, in the past 15 midterms since 1962, the S&P 500 has generated positive returns in every 6-month and 12-month period afterward. And for the 3-month period, it’s only fallen into the red four times.
It’s also interesting to note that the average S&P 500 return in the 12-month period prior to the midterms is minus-1%. This is probably due to a combination of the financial conditions at the time and the instability of the upcoming election.
Going into the midterm election year, the potential policy swings on social and economic issues represent instability.
And the market absolutely detests political instabilities.
But once the dust settled, the market responded positively.
The most striking figures are in the yellow box at the bottom of the above table, which we partially recreated in the table below. The comparison of the S&P 500’s average returns in midterm years versus non-midterm years is quite stunning, with the former either doubling or tripling the latter depending on the timeframe.
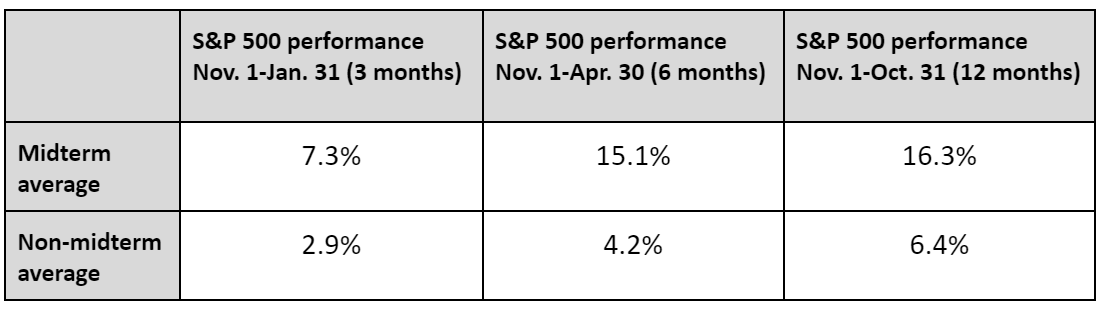
The numbers say it all.
Are Happy Days on the Horizon?
While the CPI number for October did come in lower than expected, that doesn’t mean that inflationary pressure is going away anytime soon.
With the war in Ukraine continuing, rising geopolitical tensions elsewhere, and the potential of skyrocketing energy prices during the coming winter, we may not be out of the woods just yet.
This is worrisome for risk-on assets such as equities and cryptocurrencies, because it means the FED will most likely continue its rate hikes. Even though the increments might be smaller, it would still reduce market liquidity.
So perhaps the market rally is a bit premature, and we should expect increased volatility for the few months ahead.
But there might be light at the end of the tunnel, judging by the historical performance of the S&P 500 after the midterms, as highlighted above.
In fact, the index’s 6-month and 12-month post-midterm performance averages are better than its average annualized return of 11.82% dating back to 1928.
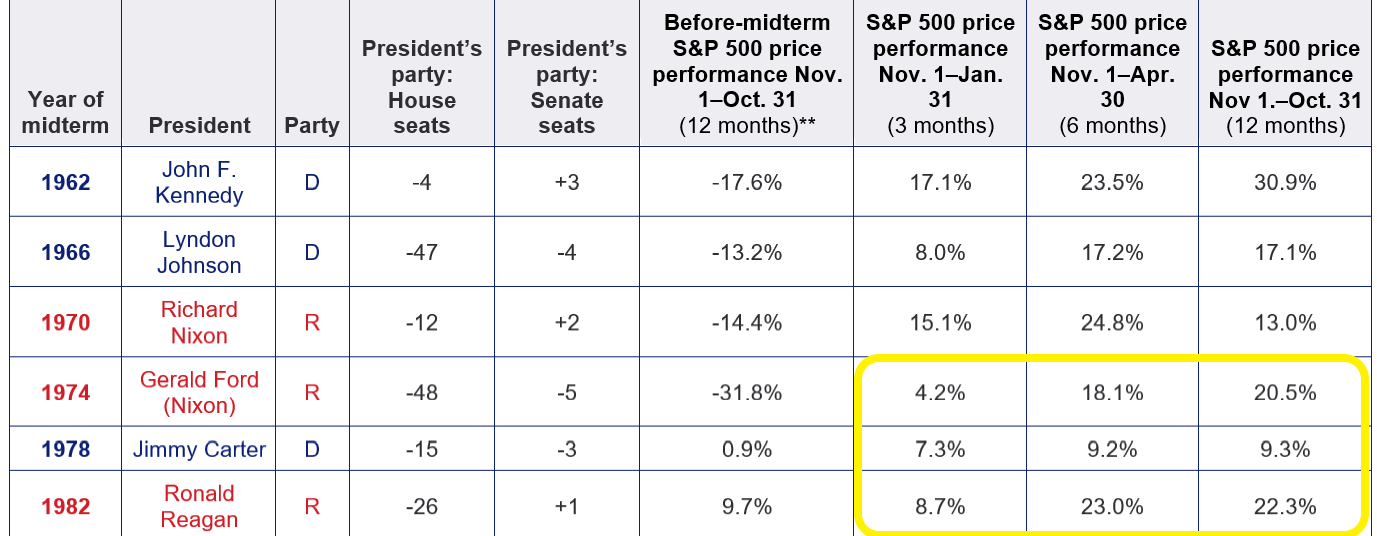
Even during the 1970s and early ’80s, which saw high inflation, high interest rates, and high volatility due to financial crises (similar to today), the S&P 500 still provided stellar returns:
As the old cliché goes: History doesn't repeat itself, but it often rhymes.
And if this past indicator is anything to go by, then risk-on investors can sleep a little bit easier at night.
Here at Jarvis Labs, we will sleep with one eye open and keep that opened eye on the market for you.
Yours truly,
TD


