Managing the Curve
Macro Update: Bank of Japan's Balancing Act


It is that time of the year again.
The blockades go up. The bleachers are raised on the side of streets. The central business district (CBD) is peppered with the lamp posts of high intensity lights.
The F1 race returns to Singapore.
Around this time of year, the CBD shuts down for a weekend. The roads are blocked off from traffic and turned into a 5.065 kilometer racetrack with 23 turns. The F1 enthusiasts flock to the tiny island. Accommodation prices and the restaurants/bars prices skyrocket. Taxis and ride-sharing services are next to impossible to hire. Traffic in and around the city center becomes chaotic.
The Singapore Grand Prixis the only night race in the entire F1 race circuit, because it’s just too hot and humid to race during the day. It is also the only other street racecourse besides Monaco now that Hanoi dropped out of the circuit.
It is a very difficult race. There are a lot of bends and chicanes crammed into a narrow and short racecourse. Along with the heat and humidity, it drains the mind and tests the focus of the drivers as they maneuver around the bends and manage the curves. It is a challenging stop.
And while the Singapore event is in the limelight, there is one curve that has the attention of traders more so than anything else. I’m speaking about the curve attached to the Bank of Japan (BOJ) with its weakening Yen.
Recently the USD kept shooting up against the JPY, and the market began to ponder if BOJ will cave in and eliminate the yield curve control (YCC) policy that started back in 2016. A policy where the BOJ is buying its own debt to keep yields from running wild.
Well, go ahead and take a seat in the grandstand, let’s look at the challenges that BOJ is up against with YCC.
The Curve that Matters
First, let’s do a quick course tour on the yield curve.
Simply put, a yield curve shows the return of a bond or fixed-income instrument over a certain period of time.
The longer it takes to pay back the bond (known as the tenure or maturity), the higher the interest rate (yield) the investor receives. Observe the chart below for an illustration of the normal yield curve. As you can see, the farther out you go on the time horizon (X-axis), the higher the yield (Y-axis).
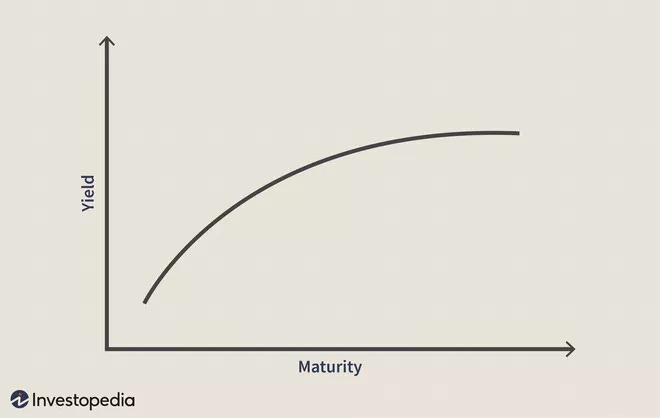
The higher yield is to compensate the investor for a higher risk of default, loss of margin of utility, and increased opportunity costs courtesy of the longer tenure.
For example, if I let my friend borrow $1,000 and she promises to pay me back in a week, I will probably just let her borrow the $1,000 without thinking too much.
But if she promises to pay me back in two years, then I might have a few concerns:
- What if she moves away and never pays me back? (Risk of default)
- I can’t use that $1,000 to replace my leaky roof or buy a new laptop. (Margin of utility)
- I can’t invest that $1,000 into a stock or a cryptocurrency to potentially boost my asset value. (Opportunity cost)
That is why with a longer time horizon, the risk of default, loss of margin of utility, and the opportunity costs will become higher. So I will charge her a higher interest rate to compensate.
The same principles apply to bonds and other fixed-income instruments. The longer the amount of time to get the investment back, the higher the interest the bond or fixed-income instruments will pay.
For example, a 2-year bond will have a lower yield than a 10-year bond because its tenure is shorter than the 10-year’s..
Once in a Blue Moon
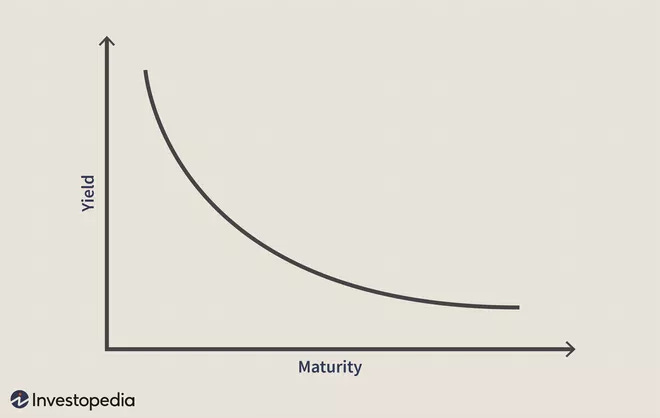
However, every so often due to economic conditions, the yield curve inverts. This means the long-term interest rate is lower than the short-term interest rate.
Please see the chart below for an illustration of an inverted yield curve. As it shows, the longer the time horizon, the lower the yield, which is the complete opposite of the normal yield curve.
To keep it simple, the main reason this happens is because the Federal Reserve (FED) or central banks (CB) hike interest rates and cause the short-term interest rate to become higher than the long-term interest rate.
Another cause is when people pile capital into long-term bonds because they expect tough times in the short term. This bids up the price for these bonds and drives their yields down, which also causes the yield curve to invert.
An inverted yield curve usually signals an economic recession is coming within the next 6-24 months. It has been quite an accurate predictor. Since 1956, every inverted yield curve has resulted in an economic recession.
Yield Curve Control
Since 2016, the Bank of Japan (BOJ) decided to install yield curve control (YCC) as the mainstay of its monetary policy.
In a very broad stroke, YCC pegs a bond of certain maturity to a yield range, rather than letting the bond’s yield fluctuate based on market activity. Central banks choose a range that they feel will promote economic growth and achieve the desired inflation rate that we mentioned in “The Divine Dichotomy.”
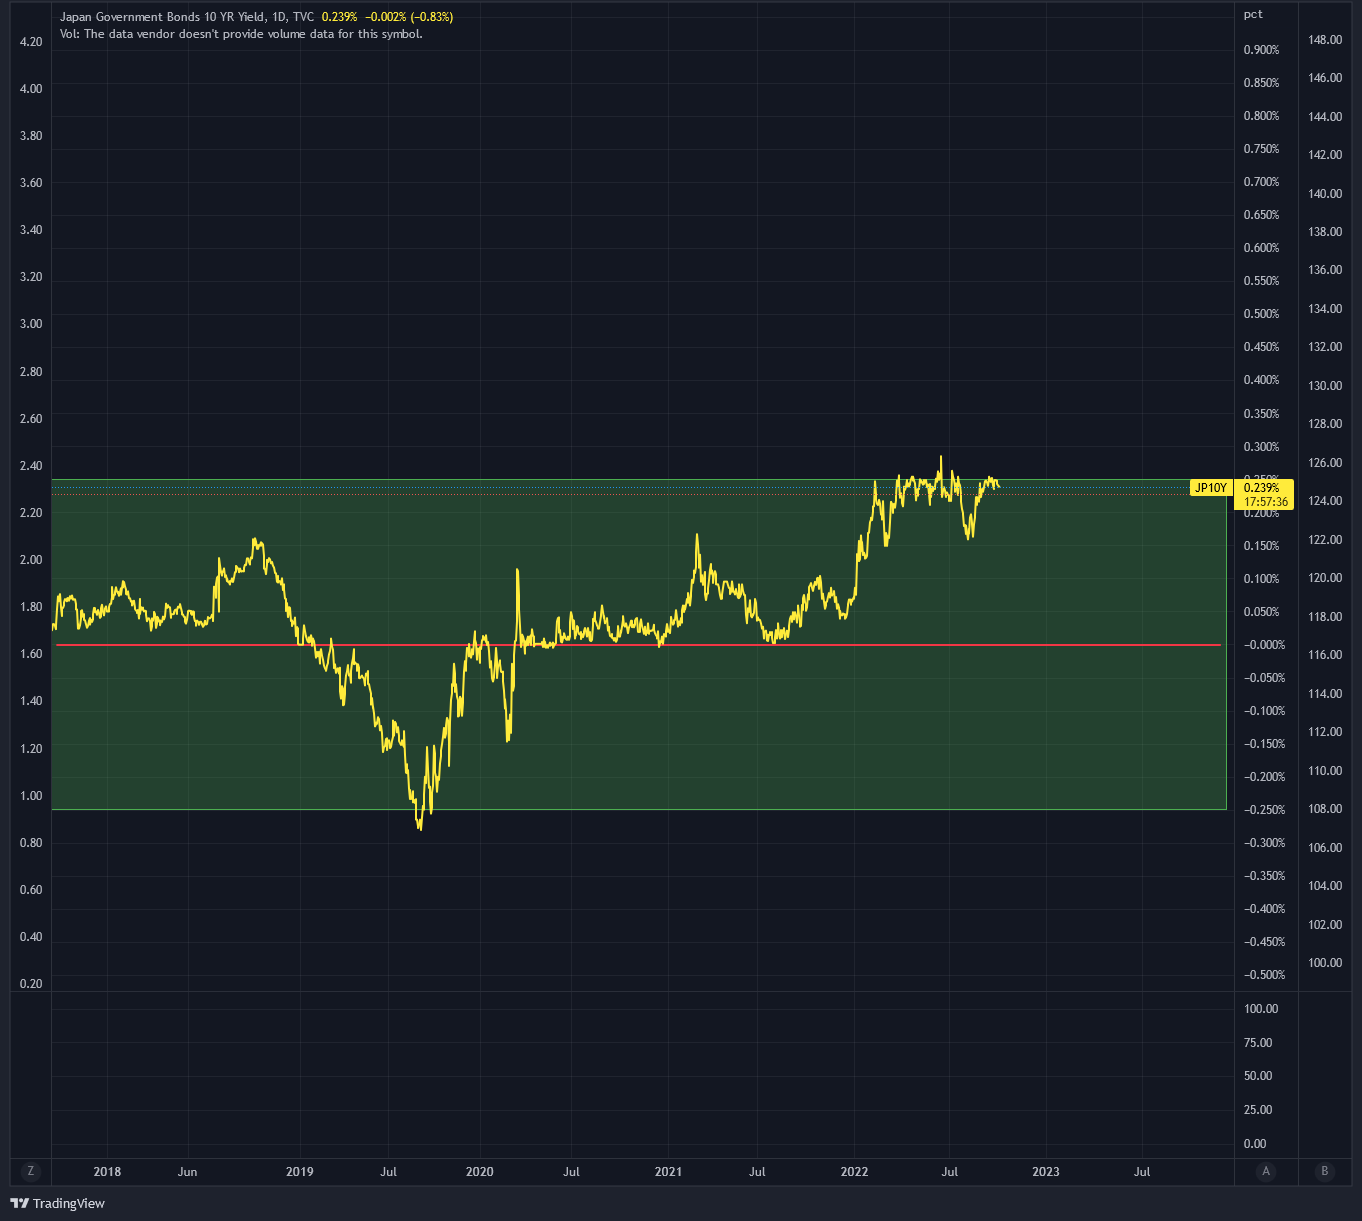
The BOJ pegged the 10-year Japanese bond (JGB10Y) to 0% and allows that range to adjust plus-or-minus 0.25 percentage points. And they will sell or buy any amount of the JGB10Y to maintain that peg. The chart below shows the plus-or-minus 0.25% allowed range in green that is determined by BOJ and the center redline is the 0.00% anchor.
YCC promotes economic growth by pegging the interest low – in theory.
The BOJ guarantees investors and buyers that the yield is not going above or below the plus-or-minus 0.25% range.
This translates to low interest rates for mortgages, business loans, car payments and corporate debts.
Did it work?
The chart below illustrates Japan’s year over year (YOY) Consumer Price Index (CPI).
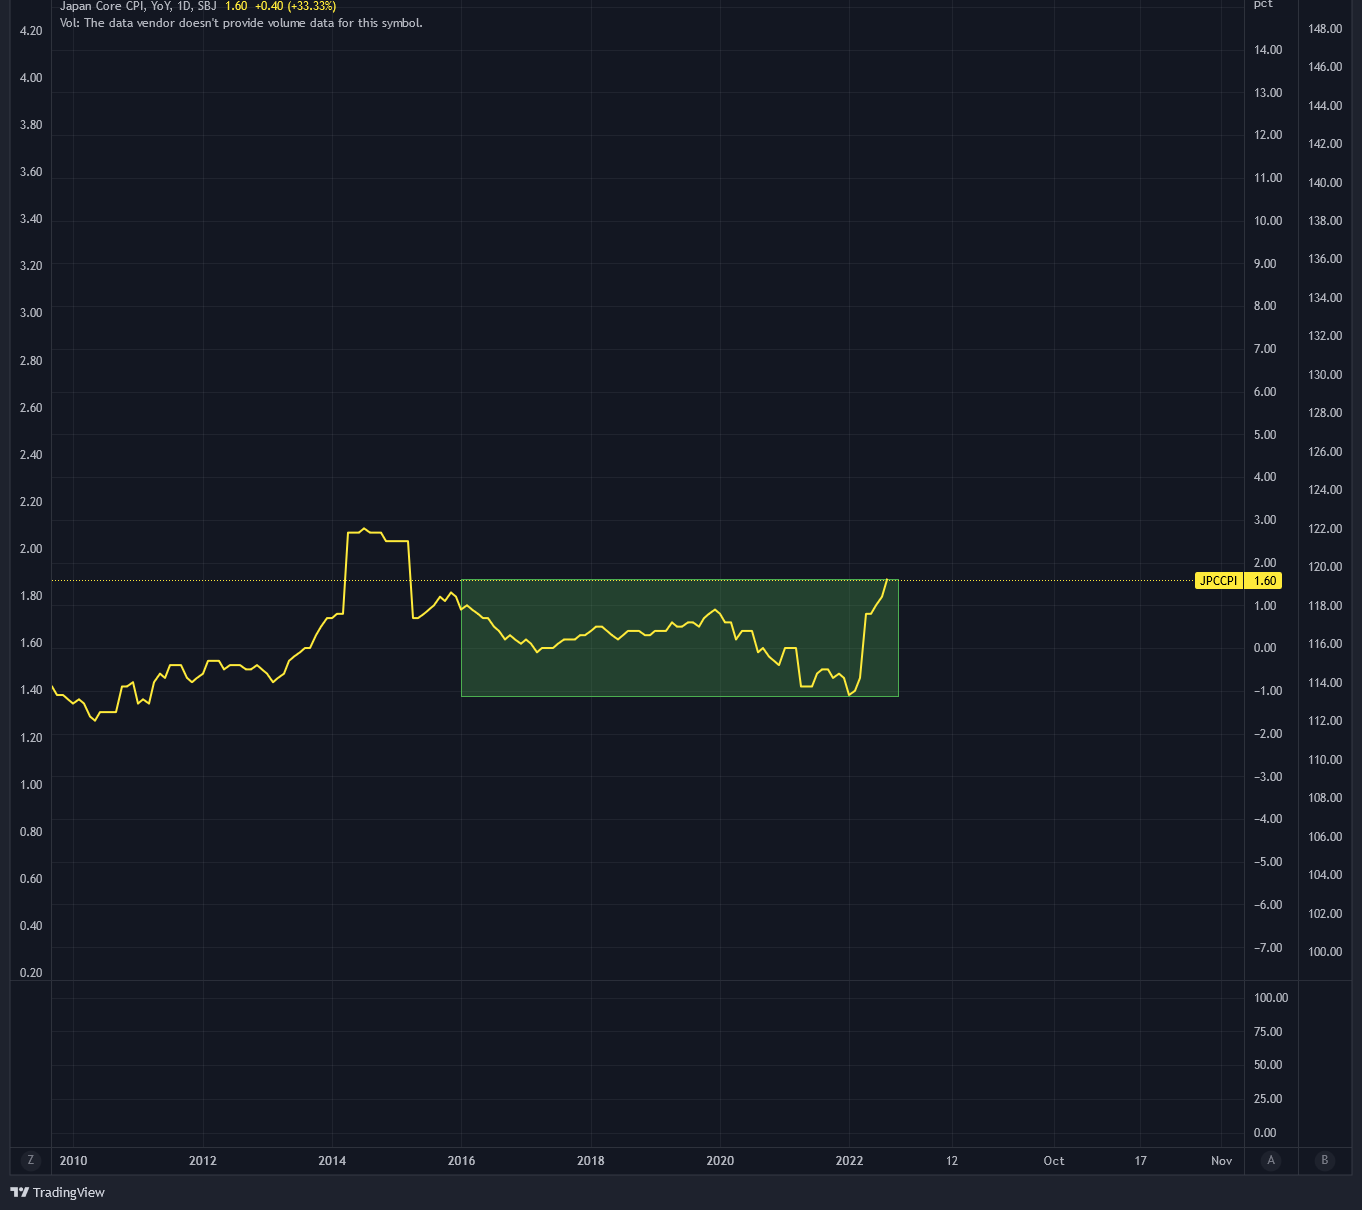
Since 2016, the Japanese CPI hovers between 1.6% and -1.2%. That is hardly delivering the targeted 2% YOY CPI figure that the BOJ yearns for.
So YCC failed at inducing inflation growth for Japan. But it at least managed to keep the Japanese economy humming along – until now.
We have a chart here showing the JGB10Y yield with USDJPY and the US 10-year Treasury (UST10Y) yield over the last year.
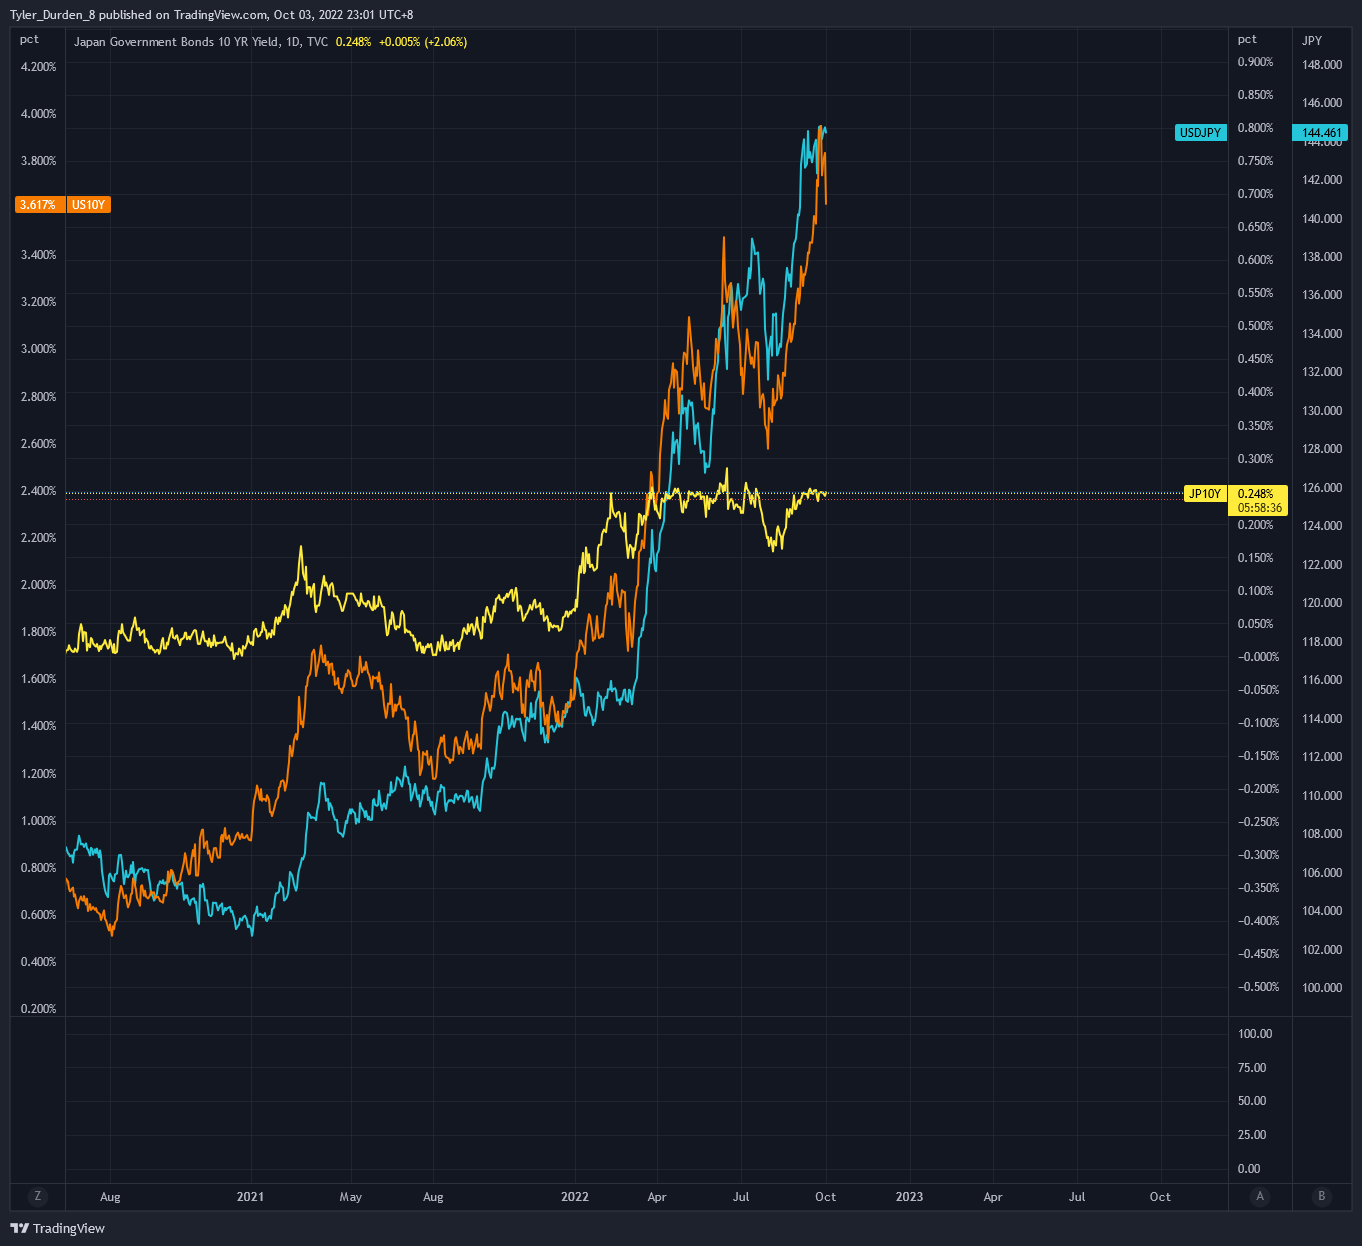
While JGB10Y (yellow line) maintained the YCC range, the UST10Y yield (orange line) spiked courtesy of Federal Reserve Chairman Powell’s determination, and the USDJPY (blue line) started to mimic the trajectory of the UST10Y.
This does not bode well for Japan. The Japanese Yen is depreciating against the U.S. dollar at its fastest rate since 1988, because investors are selling JGB in favor of UST’s higher yield.
As a result, no one wants to hold JPY and JGB. So the selloff continues and more liquidity keeps piling into the USD and UST trade. The JPY depreciates more and the BOJ cannot find buyers for JGB except for the domestic banks and the Japanese government.
While the market ponders whether Japan will do away with yield curve control, Bank of Japan Governor Haruhiko Kuroda reiterated his conviction and persistence that the BOJ will keep marching on with YCC. And Japan finally sold off UST to defend its weakened Yen at the end of last month.
A gradual depreciation of Yen is fine for Japan. It is still one of the world's major exporters and a cheaper Yen makes Japanese products competitive. Meanwhile, a sharp move in the Yen poses a serious issue with high inflation and possibly hyperinflation because all the commodities/energy/food are priced in USD.
At the same time, Japan cannot simply raise rates to attract investors, because this would be devastating to its astounding number of zombie companies and floating rate mortgages. Given its lackluster economic performance coming out of the COVID 19 pandemic, hiking interest rates in Japan is not an option.
Not to mention that Japan has the highest debt-to-GDP ratio at roughly 263%.
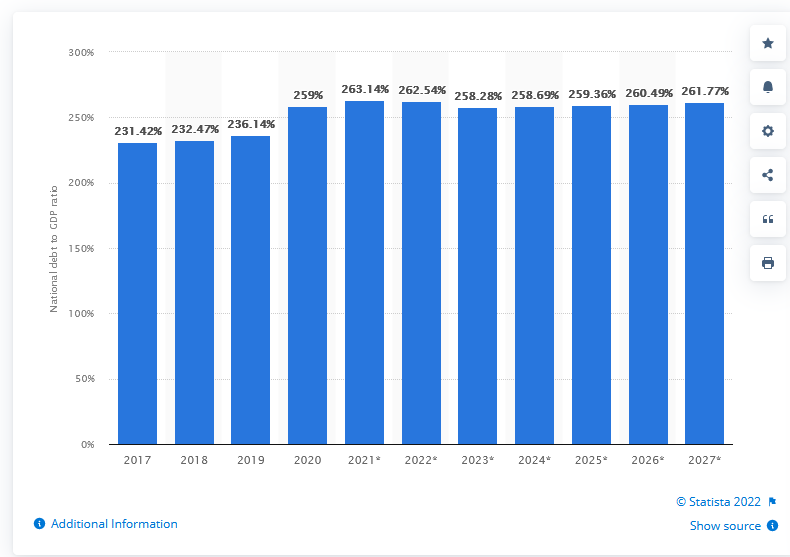
Source: Statista
And as of July 2022, the Bank of Japan now owns 50.4% of JGB. This is unheard of. Never in history has a country owned this much of its own debt. Without rate hikes, the Japanese government cannot attract investors and will have to keep printing and buying its own debt.
On a Tightrope
Japan is indeed on a tightrope while riding a unicycle and juggling a chainsaw, a torch, and a glass bottle of nitroglycerin.
There are hints that the Federal Reserve (FED) might give Japan a hand.
The FED is allowed to buy foreign sovereign bonds. This might be something to look out for should Japan’s situation get out of control.
But there is no easy way out of this in Japan.
Unlike the F1 racers who decelerate into the bend, take the proper angle and accelerate through the apex to get out of the turn, BOJ will have a much more difficult time managing its curve.
They are needing and waiting for a miracle.
We hope you enjoy this piece. Please drop a comment to let us know what you think of the situation. And please, subscribe to receive more updates.
As always, thank you for reading.
TD


