He's Back
Monday ChainPulse Update


When it came to the nearly $10 billion worth of liquidations, there were limited warning signs on-chain.
This comes from us - a team of on-chain analysts.
In fact, we think we’re bucking the trend of the last 36 hours as every thread on twitter is somebody fitting the event to their narrative.
If you’re an on-chain guy, you’ll be able to point to some abnormal inflow of BTC into one of the exchanges of your choice.
If you’re a fanboy of one exchange, you’ll point your finger at another for some malfunction or outage.
Day traders will point to funding rates. Crypto non-believers will say it’s hot air and a bubble. And many won’t do the hard work and simply call it manipulation.
As for us… You know we’re on-chain analysts that rely heavily on market structure.
Which means our narrative typically relates to an on-chain exchange flow.
But the honest truth is we actually didn’t see any transaction in particular stand out.
We’d love to show you the exact block and transaction that led to the sell off as we normally do… And maybe we’ll sniff it out in a few days, but for now, we see it as a series of events.
I’ll explain in just a moment.
But first I want to draw attention to the funding rates about 18 hours prior to the selloff.
As you can see, the rates were elevated. But in reality, these rates were not as high as we have seen during this bull run. In January, I remember seeing some readings above 0.7.
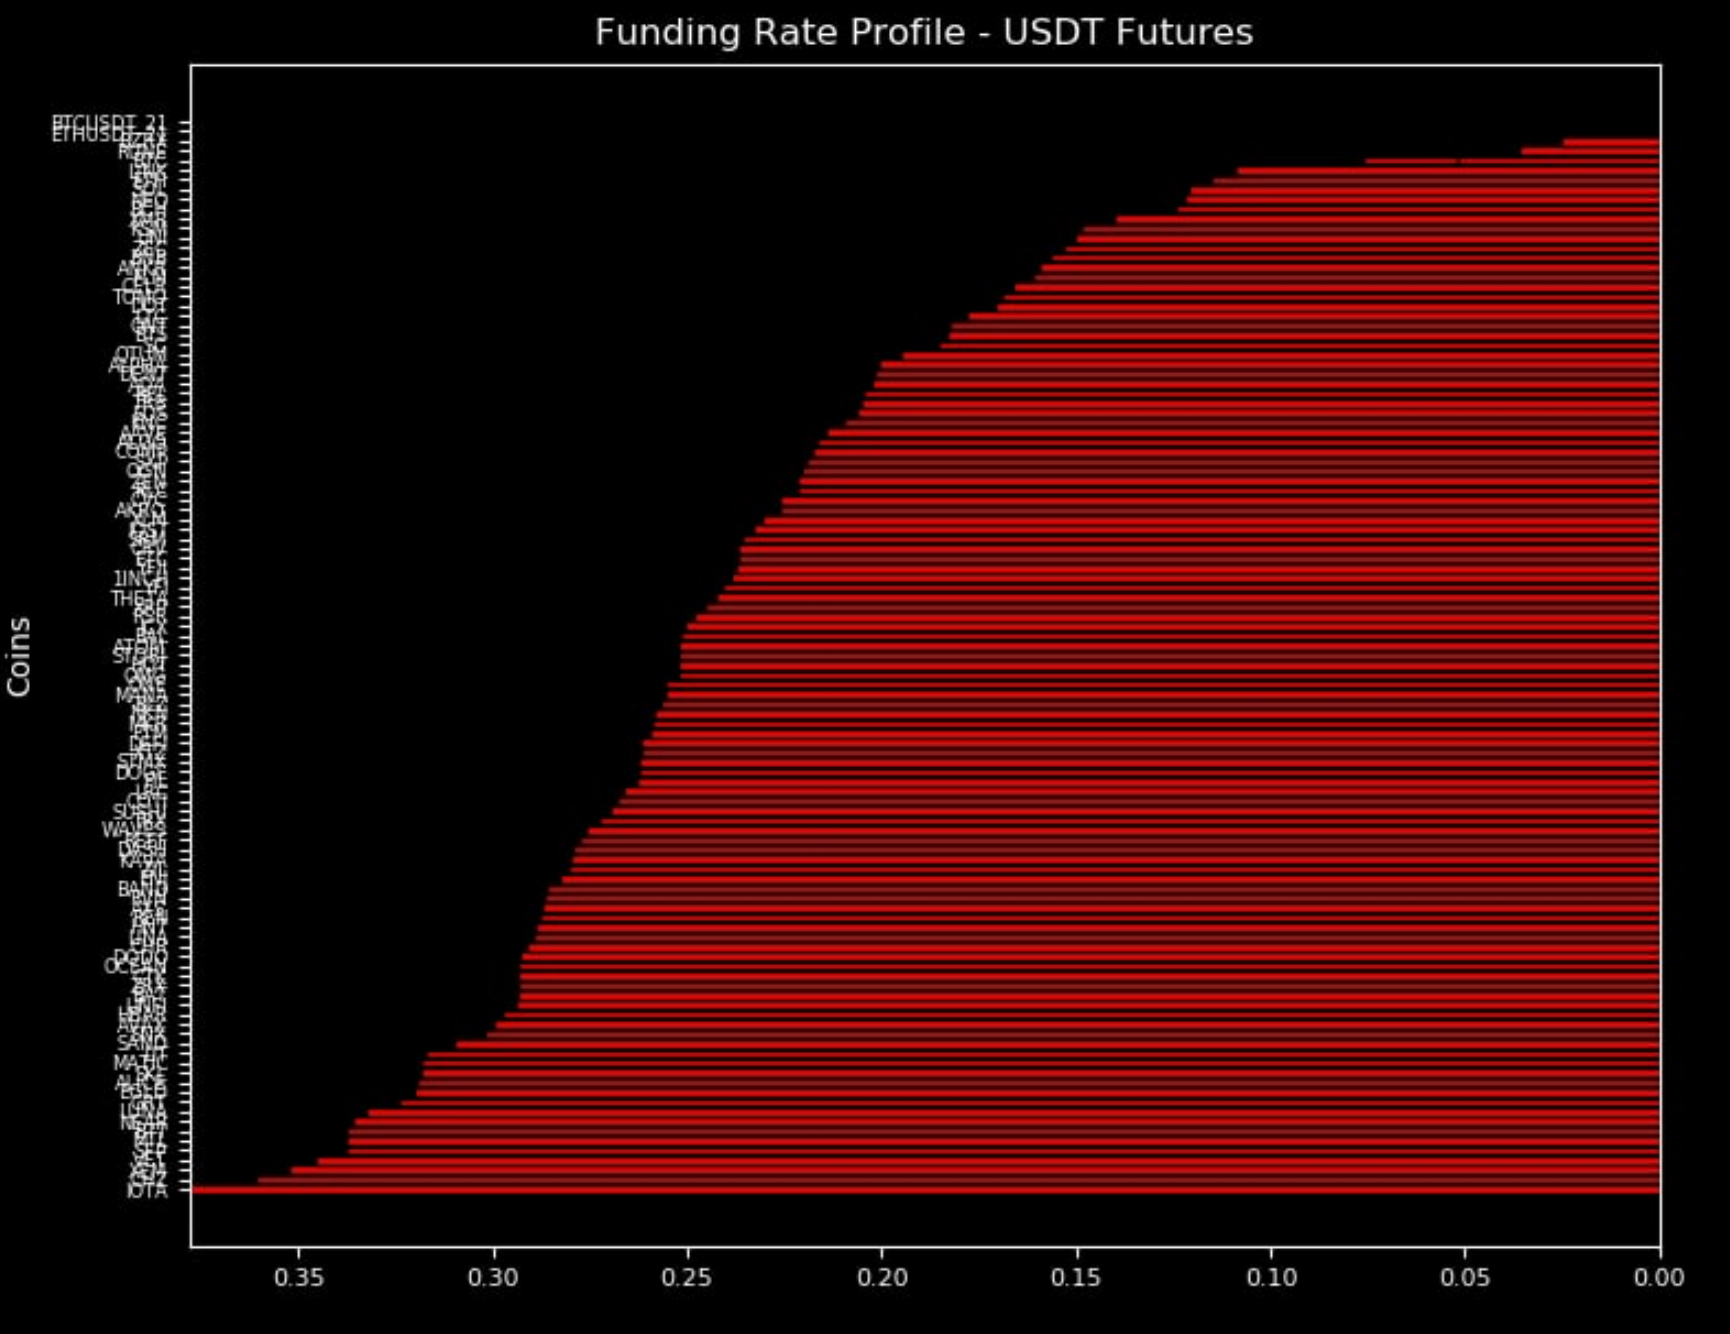
So while the rates were high, I don’t think it’s fair to simply point to the perpetual futures market and say retail traders were being crazy.
Instead, I’d like piece together the structure of the market late last week and into the weekend…
To start, let’s quickly review the exchange balance of BTC over time. On April 11 it sat at 2.34 million. By April 16th it was 2.39 million.
Each day the balance grew by one to four thousand BTC. Steady. Here are the netflows from the 12th through the 16th: 3.6k, 3.77k, 1.31k, 1.72k… That’s 10.4k. Which comes to approximately $600-630 million depending on the price per bitcoin.
Meaning exchanges were slowing creeping up in terms of selling pressure.
Then as Sam Trabucco from Alameda Research pointed to, the overhyped Coinbase listing that fell short likely created some softness in the market.
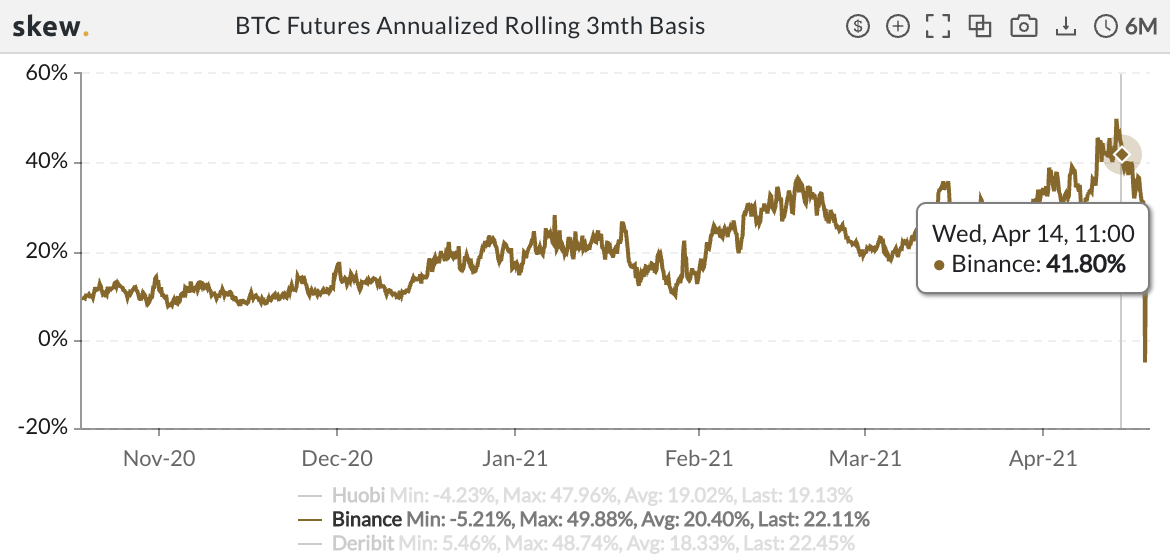
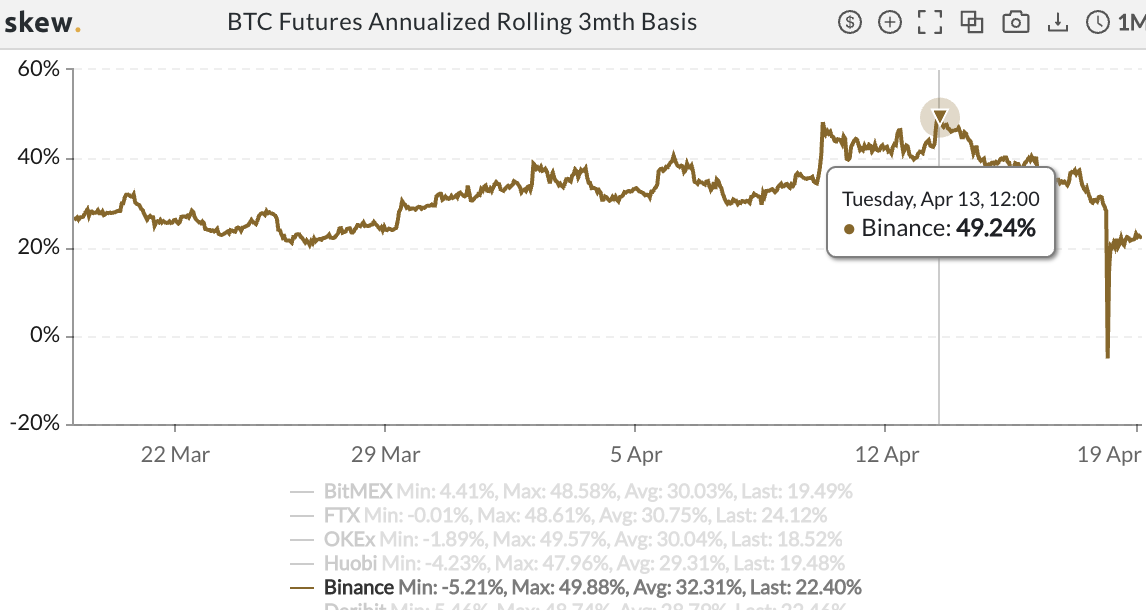
Now, while the perpetual futures funding rates for altcoins were high, but not overly alarming when comparing to other recent times… The futures contracts were.
Around the time of the Coinbase listing they were over 40%. You might remember us discussing this last Wednesday as we highlighted that this area of the market is likely to get attacked.
Well, it got attacked.
Here’s Binance June contracts showing increased volume around this time…
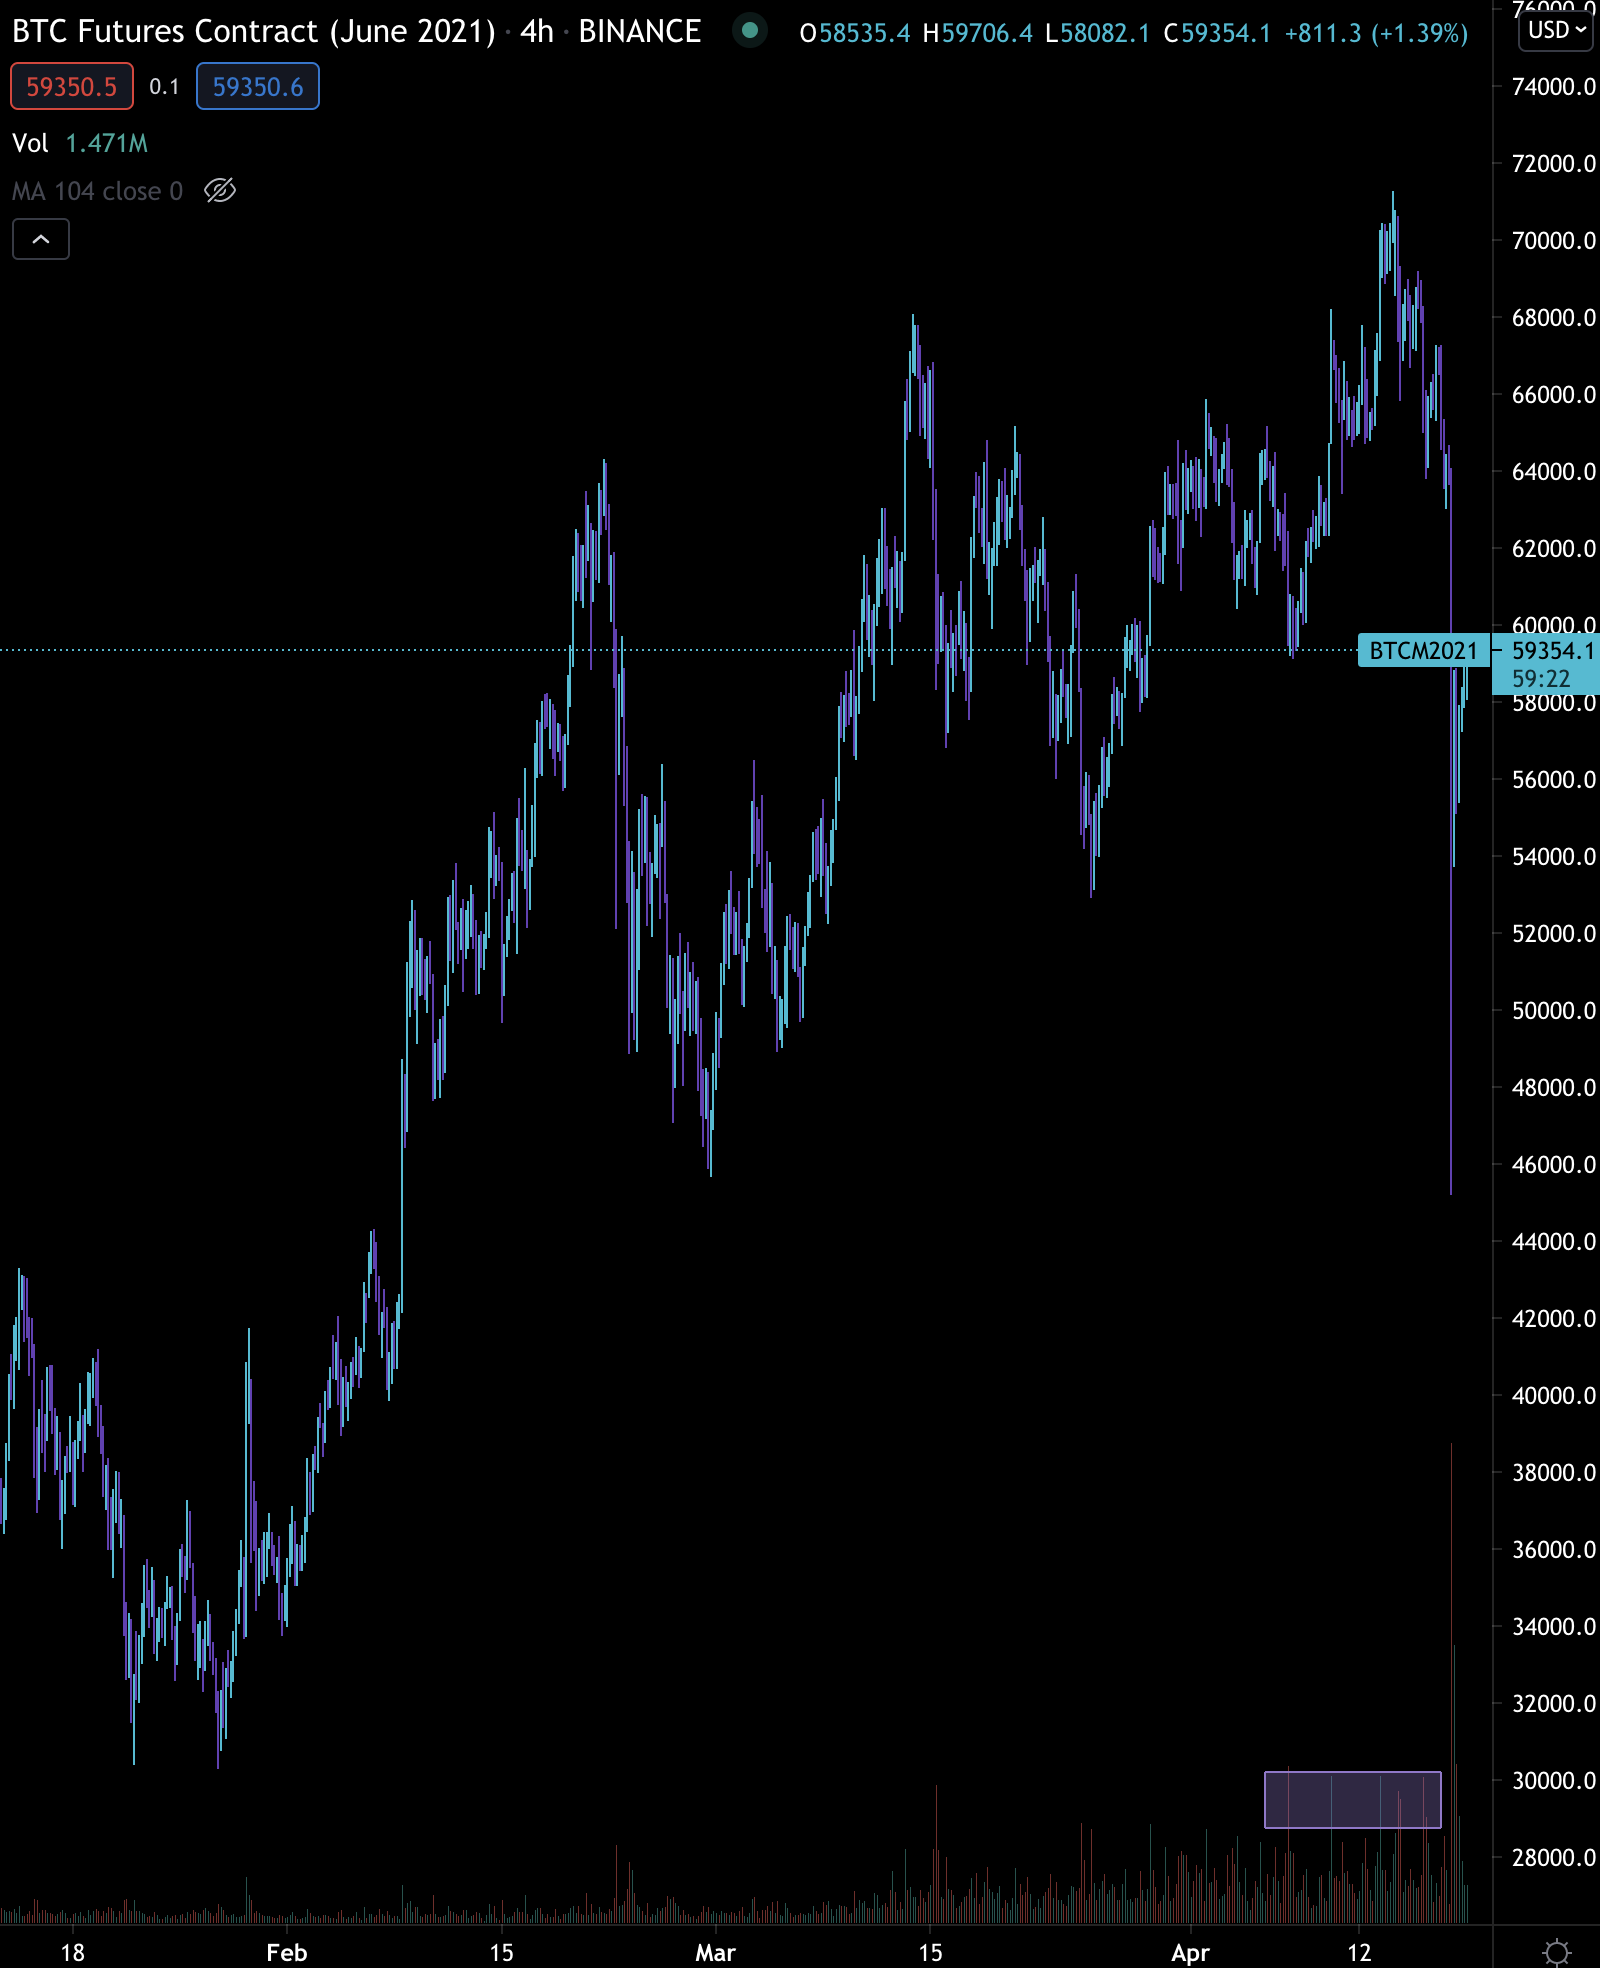
The volume on spot and perpetual futures didn’t show a big change in its profile like the futures contracts did such as the one you see above (June). I drew a bar around the volume profile so you can see the uptick last week.
To me this suggests the spread was wide enough to garner the attention of the heavy hitters. 40%+ is nothing to gloss over when you managing hundreds of millions in capital.
Backing this view point even more… We can see open interest (OI) in the futures market started to spike when the spread was the widest. Here’s the peak of OI at $27.5 billion.
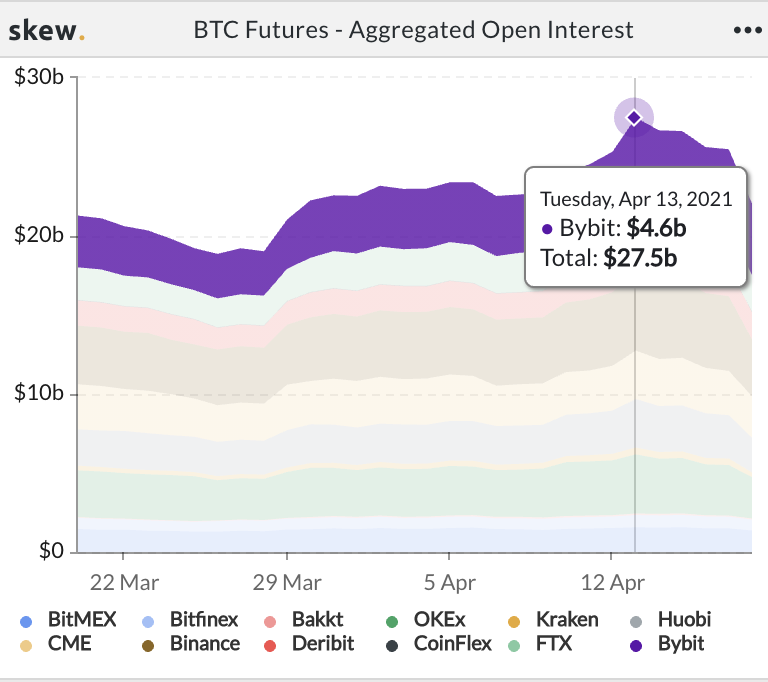
And here’s the top for the 3mo spread… Same day.
So here we are, higher selling pressure from the increased amount of BTC in exchanges, underwhelming $COIN price action, and futures selling pressure likely getting attacked by heavy hitters.
To me, this doesn’t look like manipulation or a single transaction. Instead it has the look of a series events where some of the biggest traders were exposing a market inefficiency.
And in order to attack this type of trade requires shorting June and September contracts.
This ultimately led to the crowded perpetual futures trade (first funding profile suggests this) getting sent to the cleaners to the tune of nearly $10 billion.
What’s more, even the options market helped create some cascading effect.
In the chart below you can see some sizable red bars. These red bars highlight impactful negative gamma below $61k. Meaning market makers were selling BTC as price dropped in order to remain delta neutral.
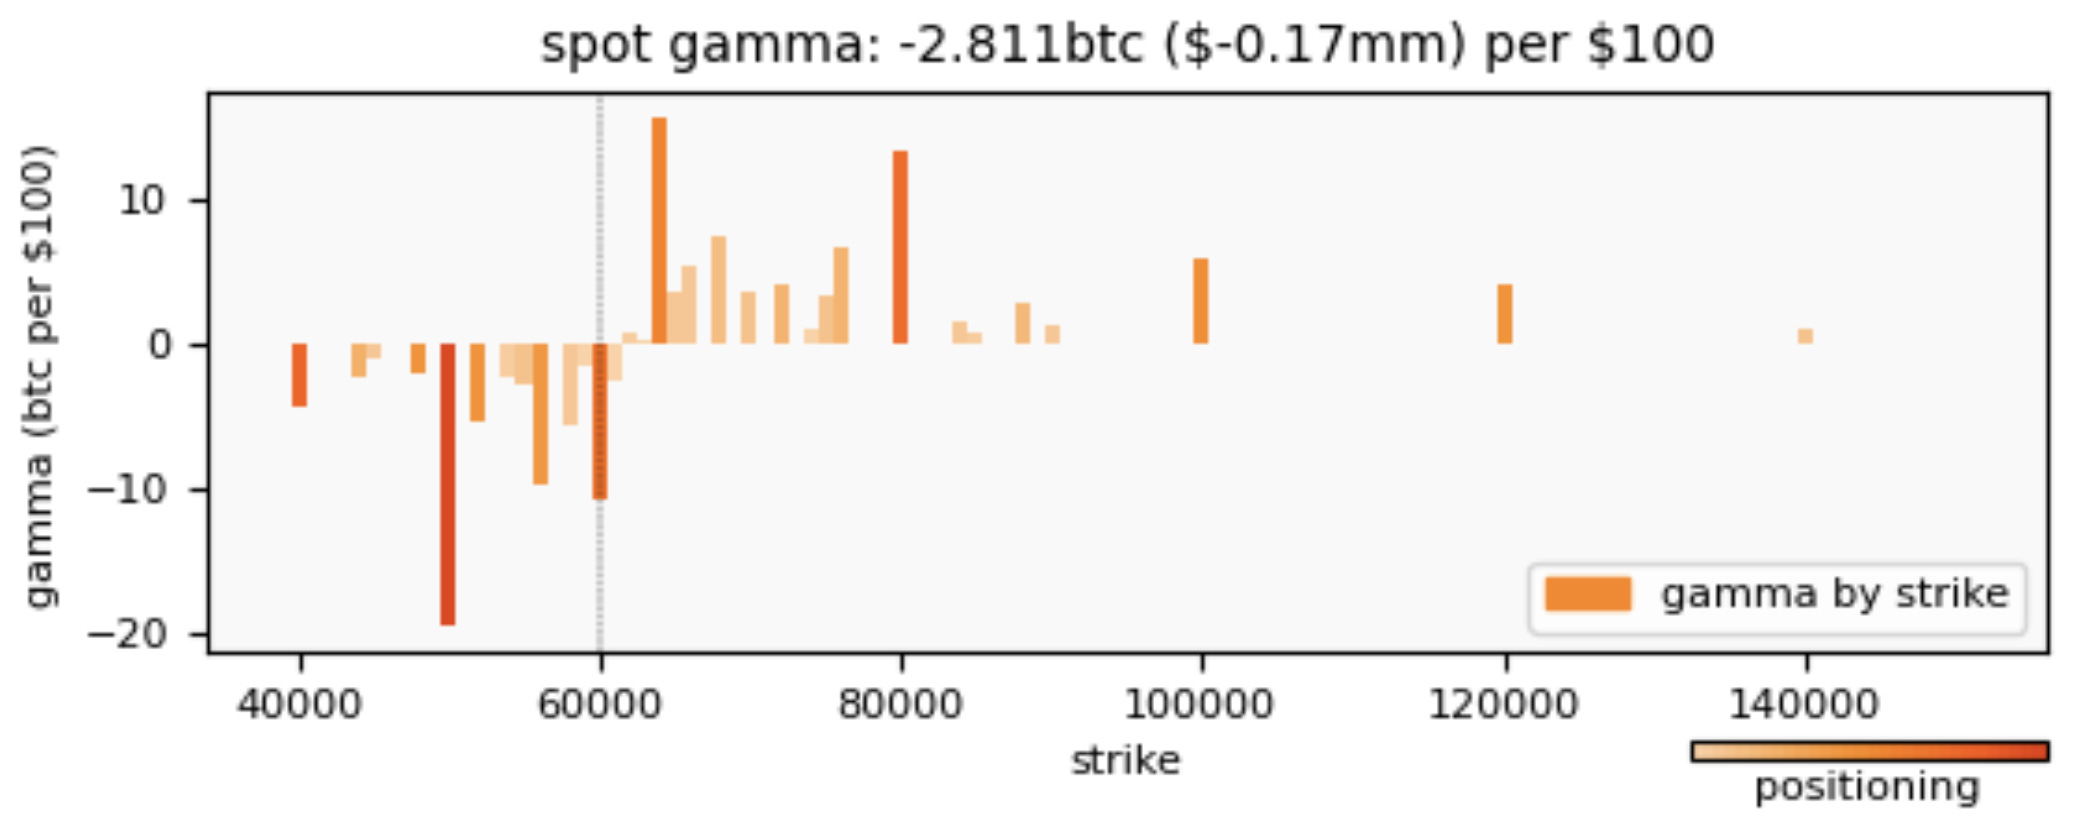
While this gamma effect wasn’t big enough to move the market on its own, it certainly helped create momentum to the downside. Which is yet another contributing factor in this series of events.
Then throw in some Chinese miners going offline, some hacked twitter accounts posting bearish news, and a few other things…
Soon enough you have a buffet table of market drama for everyone to build their own story… My version was one that encompassed half a dozen factors.
While it might not be the exact reason for why the markets got a bucket of cold water to the face, it’s a decent start.
If we find more information in the next few days that pinpoint to a main player, we’ll likely share it here in Espresso.
In the meantime, as we look forward…
Pablo is back and Benjamin is feeling ill.
Yup, you read that correctly. It came in yesterday.
Now, instead of detailing what it all means… Let me share with you a post of what Benjamin wrote to clients. Keep in mind, Benjamin keeps clients up to date throughout the day AND night.
He’s so tied up in the market he told traders to close their personal altcoin positions before the weekend as a precaution. His advice is wise.
So here are his unfiltered words.
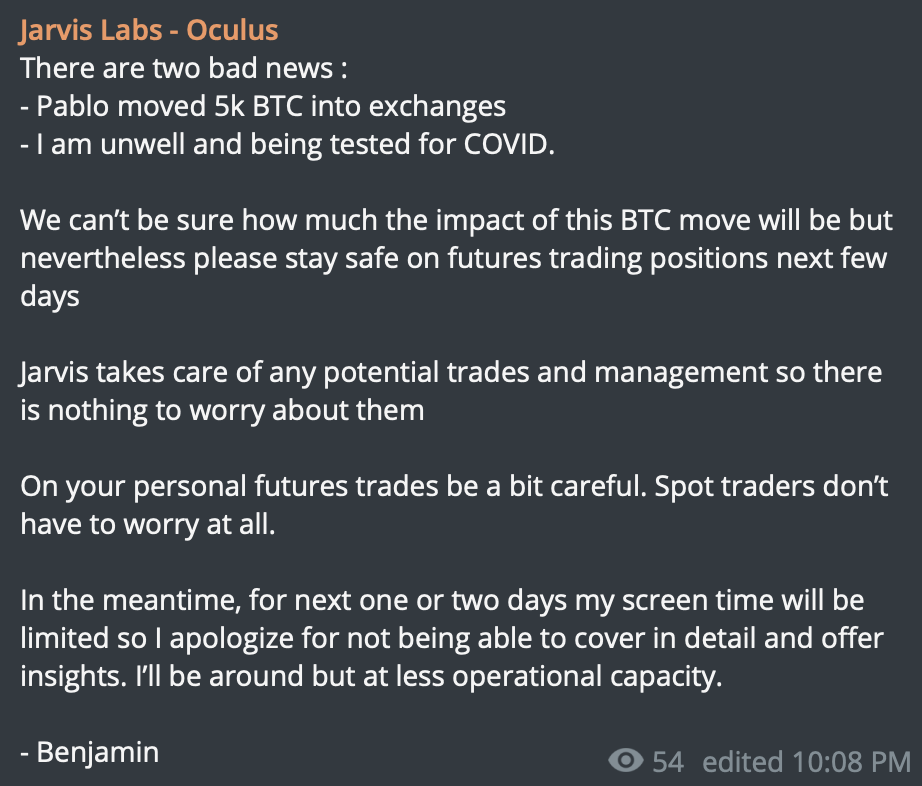
Let’s all hope he feels better in the coming days…
-B
P.S. - Pablo hasn’t had the best timing lately. In fact he tends to show up just in time for the last push lower before we reverse. So don’t consider this ultra bearish, just more along the lines of a caution. For those that don’t know about Pablo, read this.


