Here's How The Market Is Positioned
Options Market Update: 22 Feb 2024


If you’re not paying attention to the options market, you’re missing out.
The past couple of weeks we’ve been showcasing how the options market has quickly shifted into overdrive.
This was after a boring lull to start 2024.
You see, options are reflexive. Which means high volatility begets more volatility. And right now, volatility is the trend we see picking up speed.
Let me show you.
As mentioned on Tuesday morning’s episode of The Trading Pit, this recent run up above $52,000 for Bitcoin has led many to hedge their BTC exposure through put option buying as we near the end of Q1.
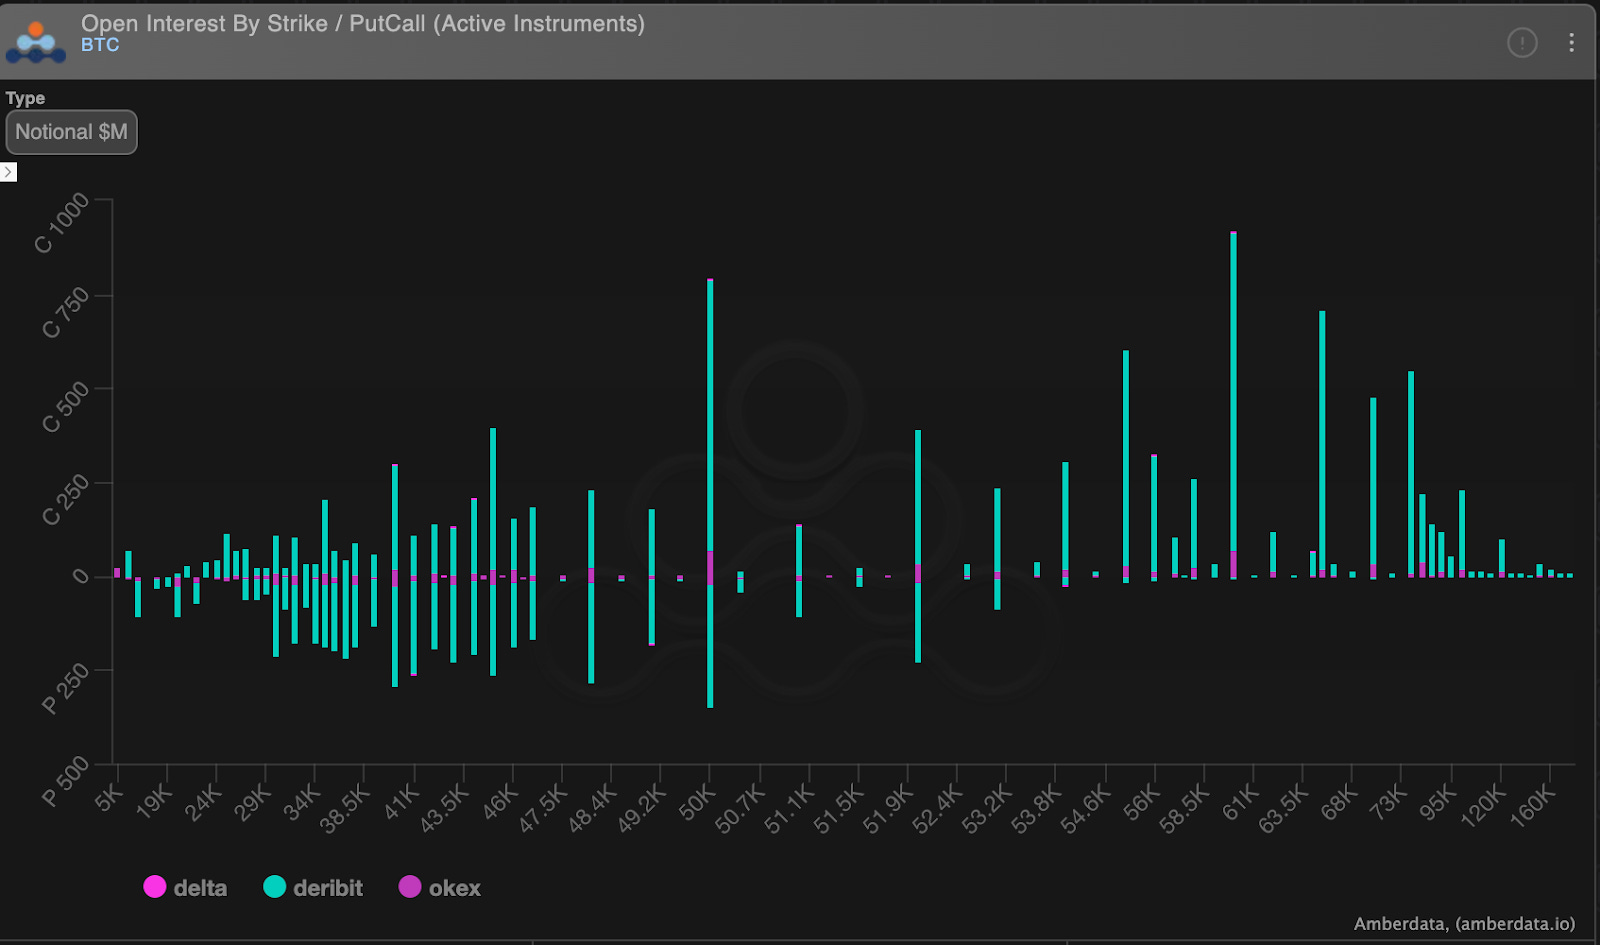
On the chart below we can see how the market is currently positioned whether price goes up or down. We have major amounts of both calls and puts sitting at $52,000 and below. And as we look higher, past the $55,000 level we see it’s all calls.
This tells us the market is well positioned for a high volatility breakout in either direction.
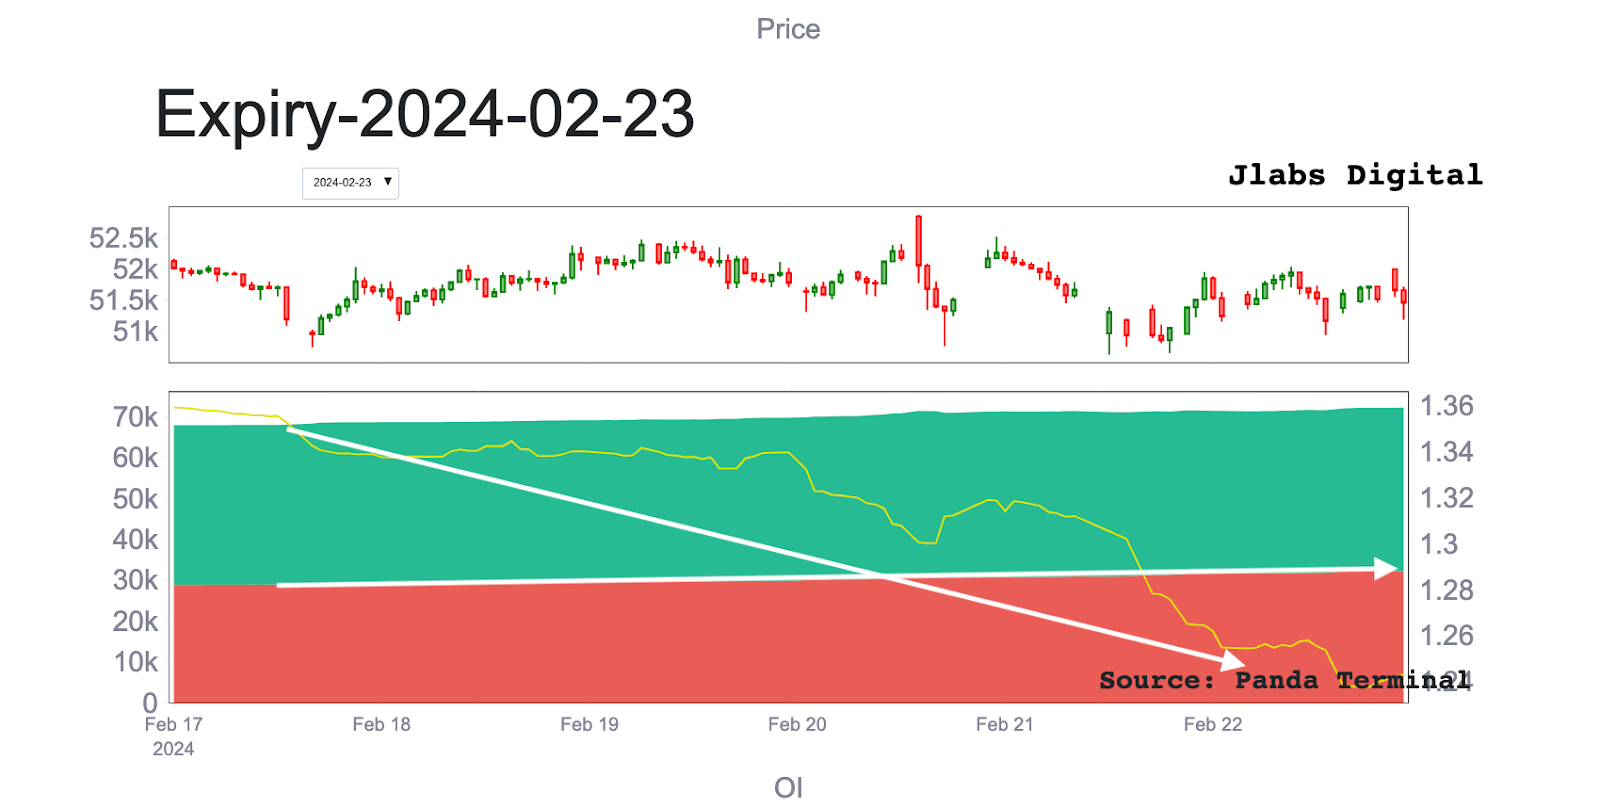
This structure began forming as demand for puts appeared following last Friday’s option expiration. There was a sudden demand for short-dated put options expiring today, February 23rd. You can see when the market quickly began to hedge their call positions with these puts. I highlighted it with the arrows below. The salmon chart shows open interest for the February 23 contract while the subplot below it shows the 24hr rate of change of this open interest.
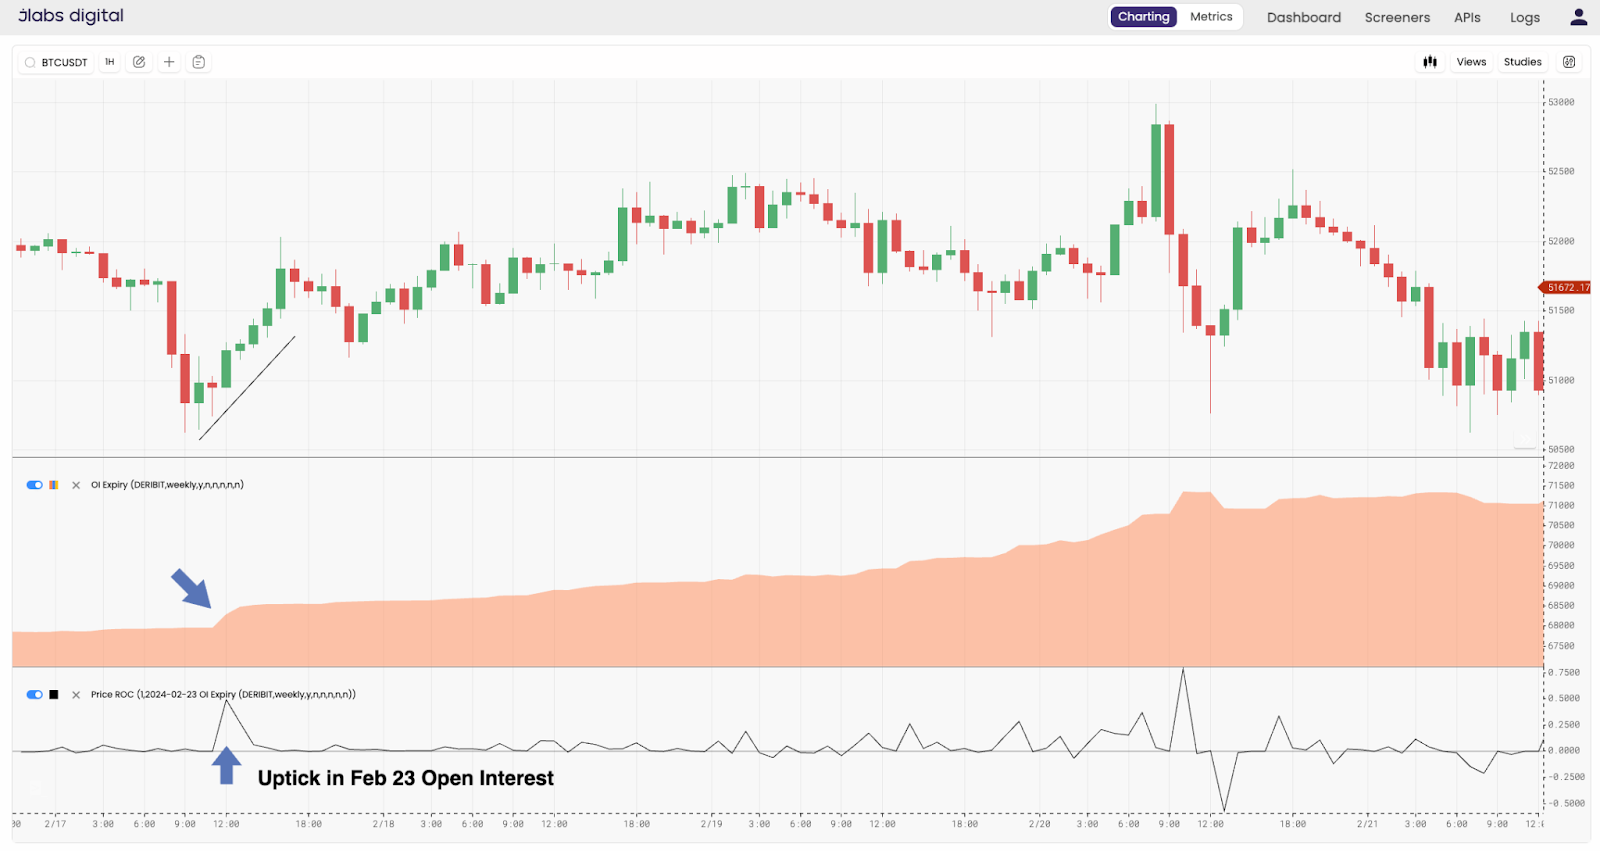
In total there were over 3,000 new put contracts created last Friday. This brought total put open interest to 32,000 BTC in total.
You can see this by following the white arrows highlighting the change in the red shaded area in the chart below, as well as the yellow line which shows us the call-to-put ratio. When the red line rises more than the green line, the yellow line drops. This tells us more puts are being opened up compared to calls.
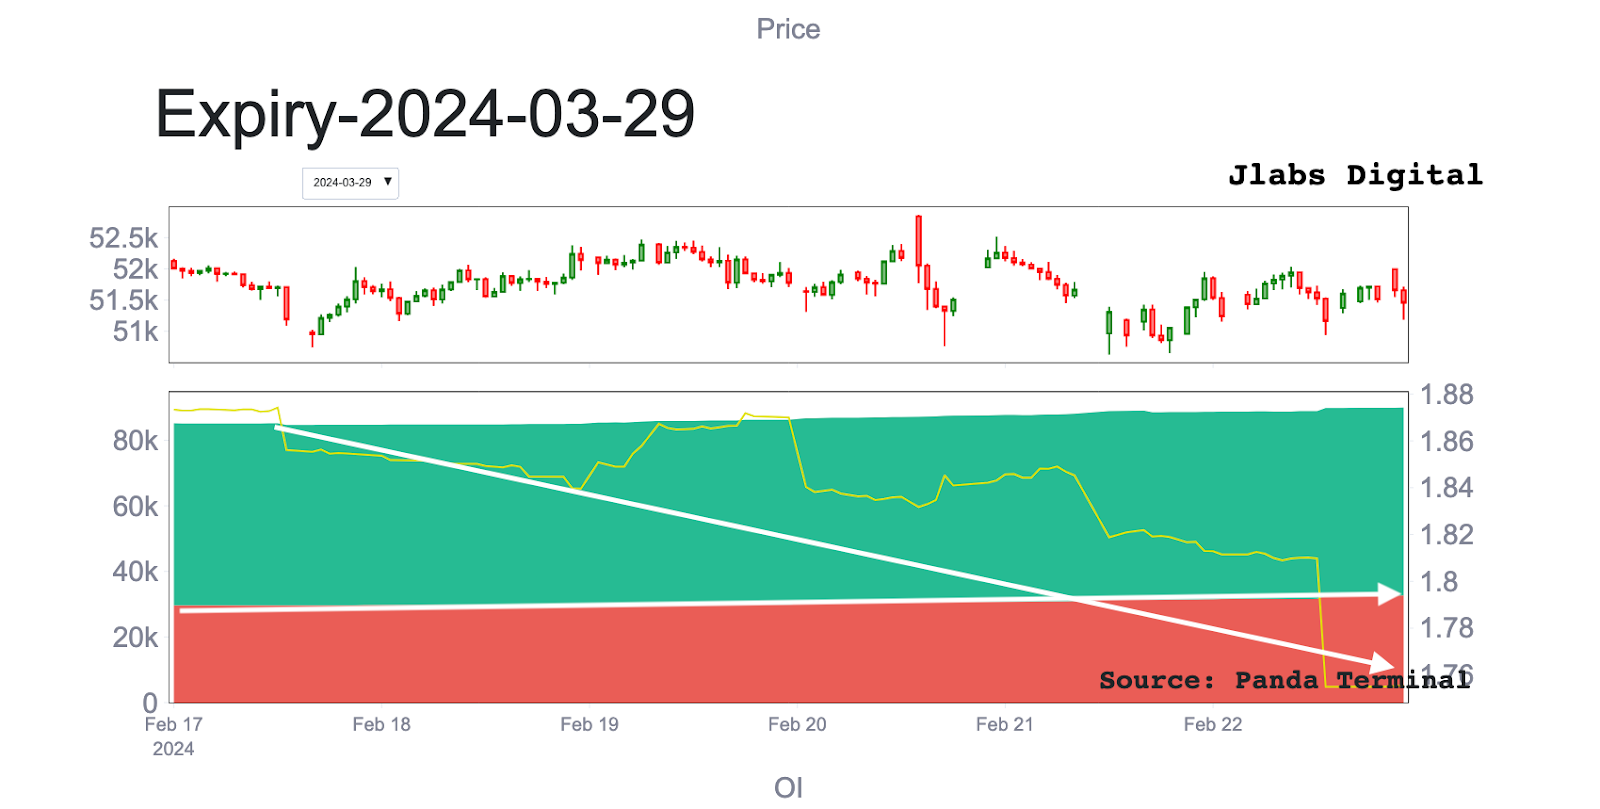
The same was true of the March 29th quarterly expiry. This expiry saw 3,000 new put positions added over the past week. And like the February expiry, now has over 32,000 BTC worth of put OI.
This sudden demand for short dated puts reflects itself very well in another metric called 25-Delta Skew. We talked last week how calls were much more expensive than puts across all expiries.
Last Friday we can see this metric reversed hard, making puts more expensive relative to calls.
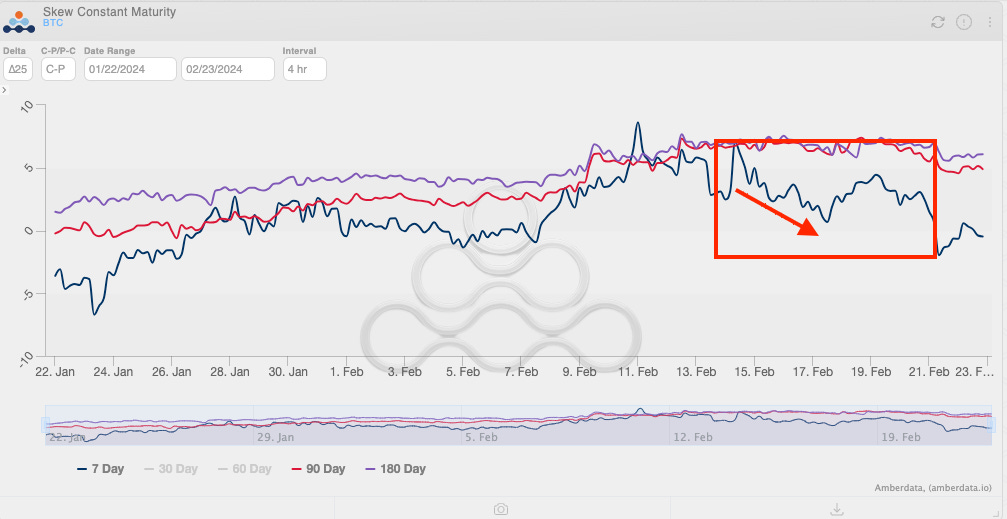
As a reminder, this delta skew takes the cost of a call minus the cost of put that are equal distances from the current price of the Bitcoin.
A rising skew is a lot like a funding rate getting very costly for a long. If skew is falling, means shorts are getting expensive to open… Only in this case, for puts.
Ultimately, the market’s urge to hedge here is a healthy sign that we’re not getting too overheated which is exactly the type of behavior you’d like to see as price consolidates below resistance at $53,000.
This scenario creates opportunity for fresh call buyers to step-in and buy call positions trading at a discount to last week’s pandemonium. This would set us up for another leg higher towards those currently out-of-the-money strikes at $55,000 and above.
Whether or not this new influx of demand will show-up at the current $51,000 level, or if they’re awaiting lower levels for entry remains to be seen, but I suspect we’ll have a better idea by the end of this week as the February 23rd contracts expire.
Be sure to keep tuning in to the Trading Pit where we'll unpack this further and let you know once we see more directional clues pop-up.
Until then…
Watching the tape,
JJ


