FOMC Playbook
Market Update: A 100% hit rate for 2022


Did you comment?
I’m talking to you. You, the reader of Espresso who has enjoyed the parabolic bull run and is now weathering the bear market alongside us.
I’m asking today to hear from you.
The independent research we are beginning to ramp up is beginning to focus on several themes… Themes that are starting to take shape.
TD writes on macro economic themes. Kodi writes on token fundamentals. And apparently some of you met our Janitor who I just heard writes about technical analysis and onchain. (Seems we should talk to JJ and ask if he wants to train to be an analyst)
Then there is me. I write market updates for crypto and paint crypto’s position within the larger financial world.
Yes, it might seem a bit scatter brained. A bit all over. Maybe somewhat lacking structure. It’s early… And we only plan to add more writers.
Which is why I want to know what you think. What do you like. What could improve. What is missing…
How can we make Espresso better for you.
Don’t be afraid to tell us what you think. We have thick skin, so don’t hold back.
As we await your comment, I’d like to take this time for a quick market update.
DOGE coin is howling, SHIB is nipping at its heels, and the market is wondering if this rising pack of coins are signaling a start or an end to a cycle.
The way we can view all of this is by diving into a few relevant points about the market as we approach the Federal Reserve FOMC meeting decision tomorrow.
You’ll shortly see, there is an interesting trend that has unfolded around FOMC and crypto for 2022. One we can unpack here.
Let’s dive in.
Three Points
There are three items I’d like to bring up when discussing the cryptocurrency market. By touching on these three items it’ll setup what has historically happened in the run up to FOMC in the markets, and the aftermath of the meeting.
It’s a pattern that has happened for every meeting in 2022.
But before we get to it, the first of the three points I’d like to touch on is onchain accumulation. This is a personal favorite of mine because it makes life easy. If you see solid accumulation, you can use it as a backstop for all other analysis.
Meaning if things start to lean bullish on a chart and accumulation is running strong, go with that hunch. The opposite is true as well. It’s merely a way to stack the deck in your favor.
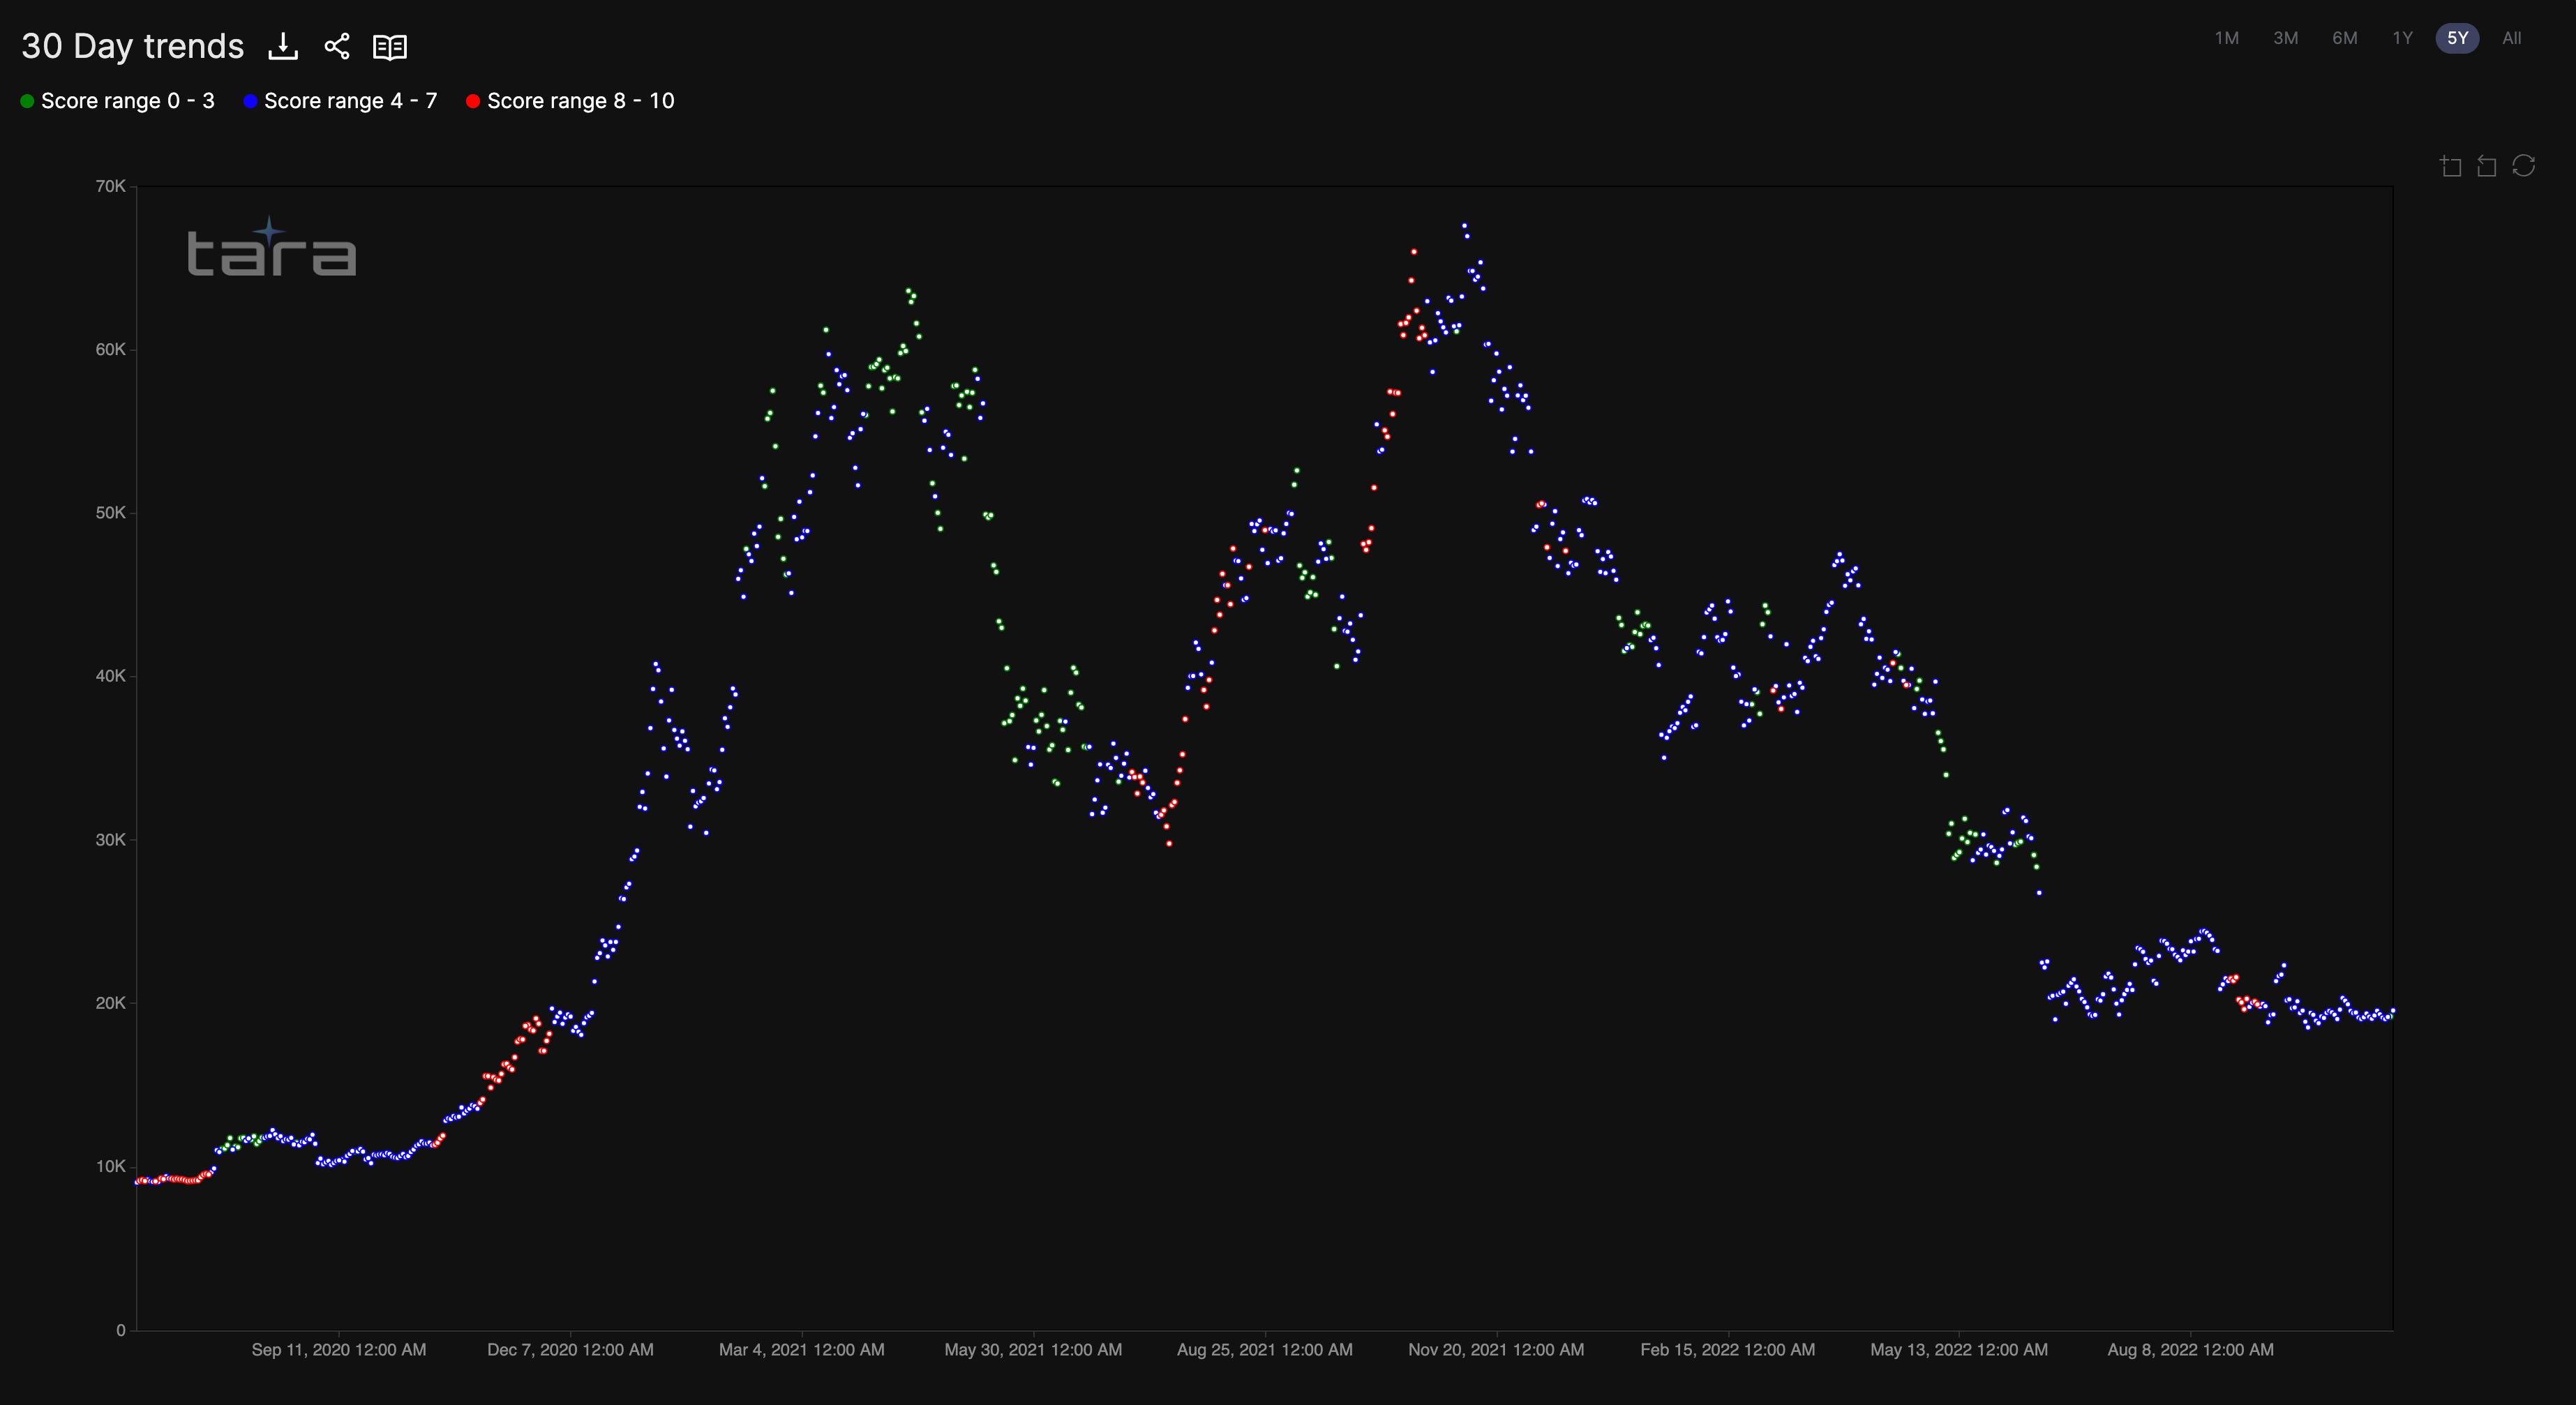
Right now, there is still little to nothing. Here is accumulation for Bitcoin. This chart is from our Tara dashboard, an analytics platform we will be using as our testnet for our newest metrics.
This version of accumulation filters things down to bullish, neutral, bearish. Right now, it’s neutral (blue).
We can also see a simple table that breaks down accumulation or distribution happening by wallet size on Tara. The table below within the red box shows that larger wallets in the 100 to >10k range are offsetting one another.
The white box shows retail is accumulating, which is not a signal to follow.
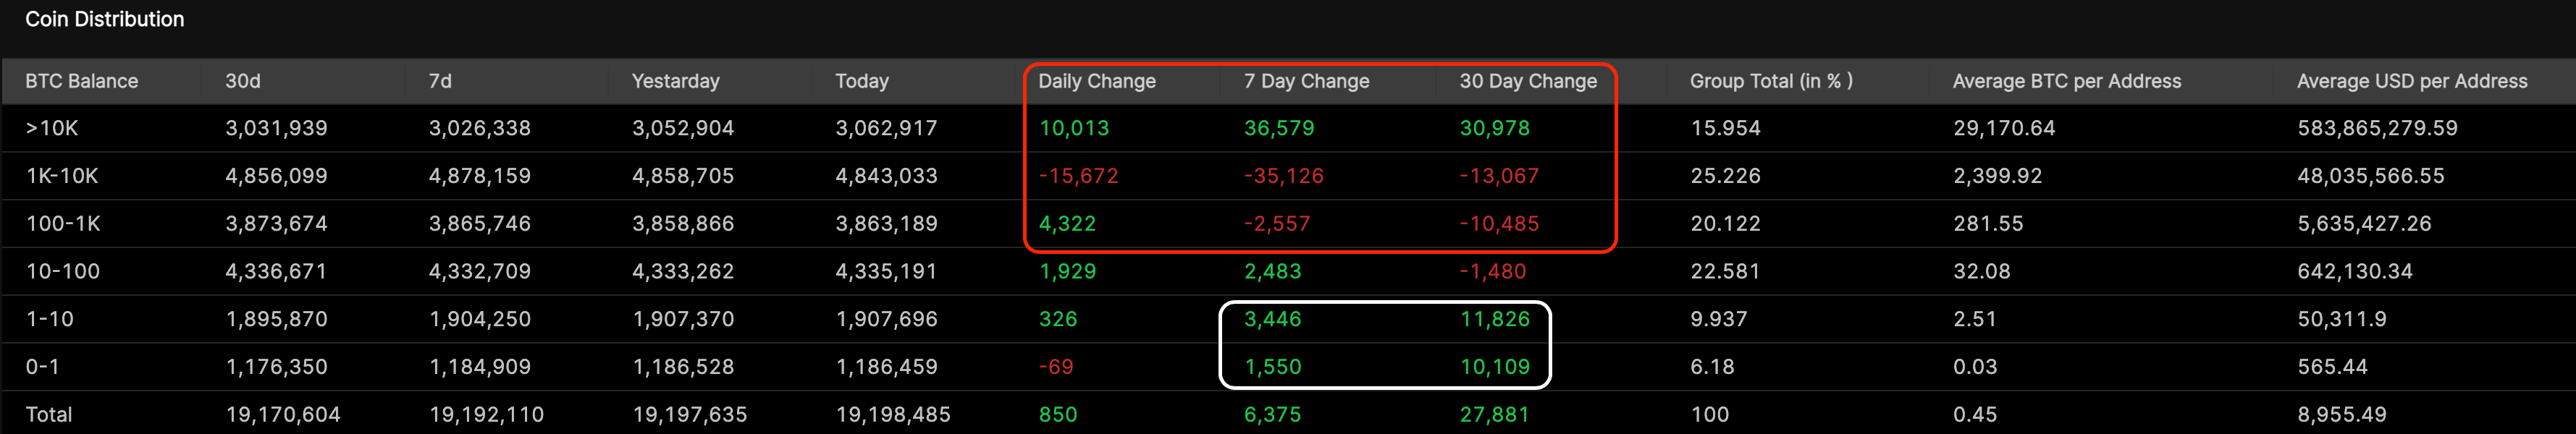
Combined, we lack the bullish backstop we want. With that in mind, let’s take a look at two more charts.
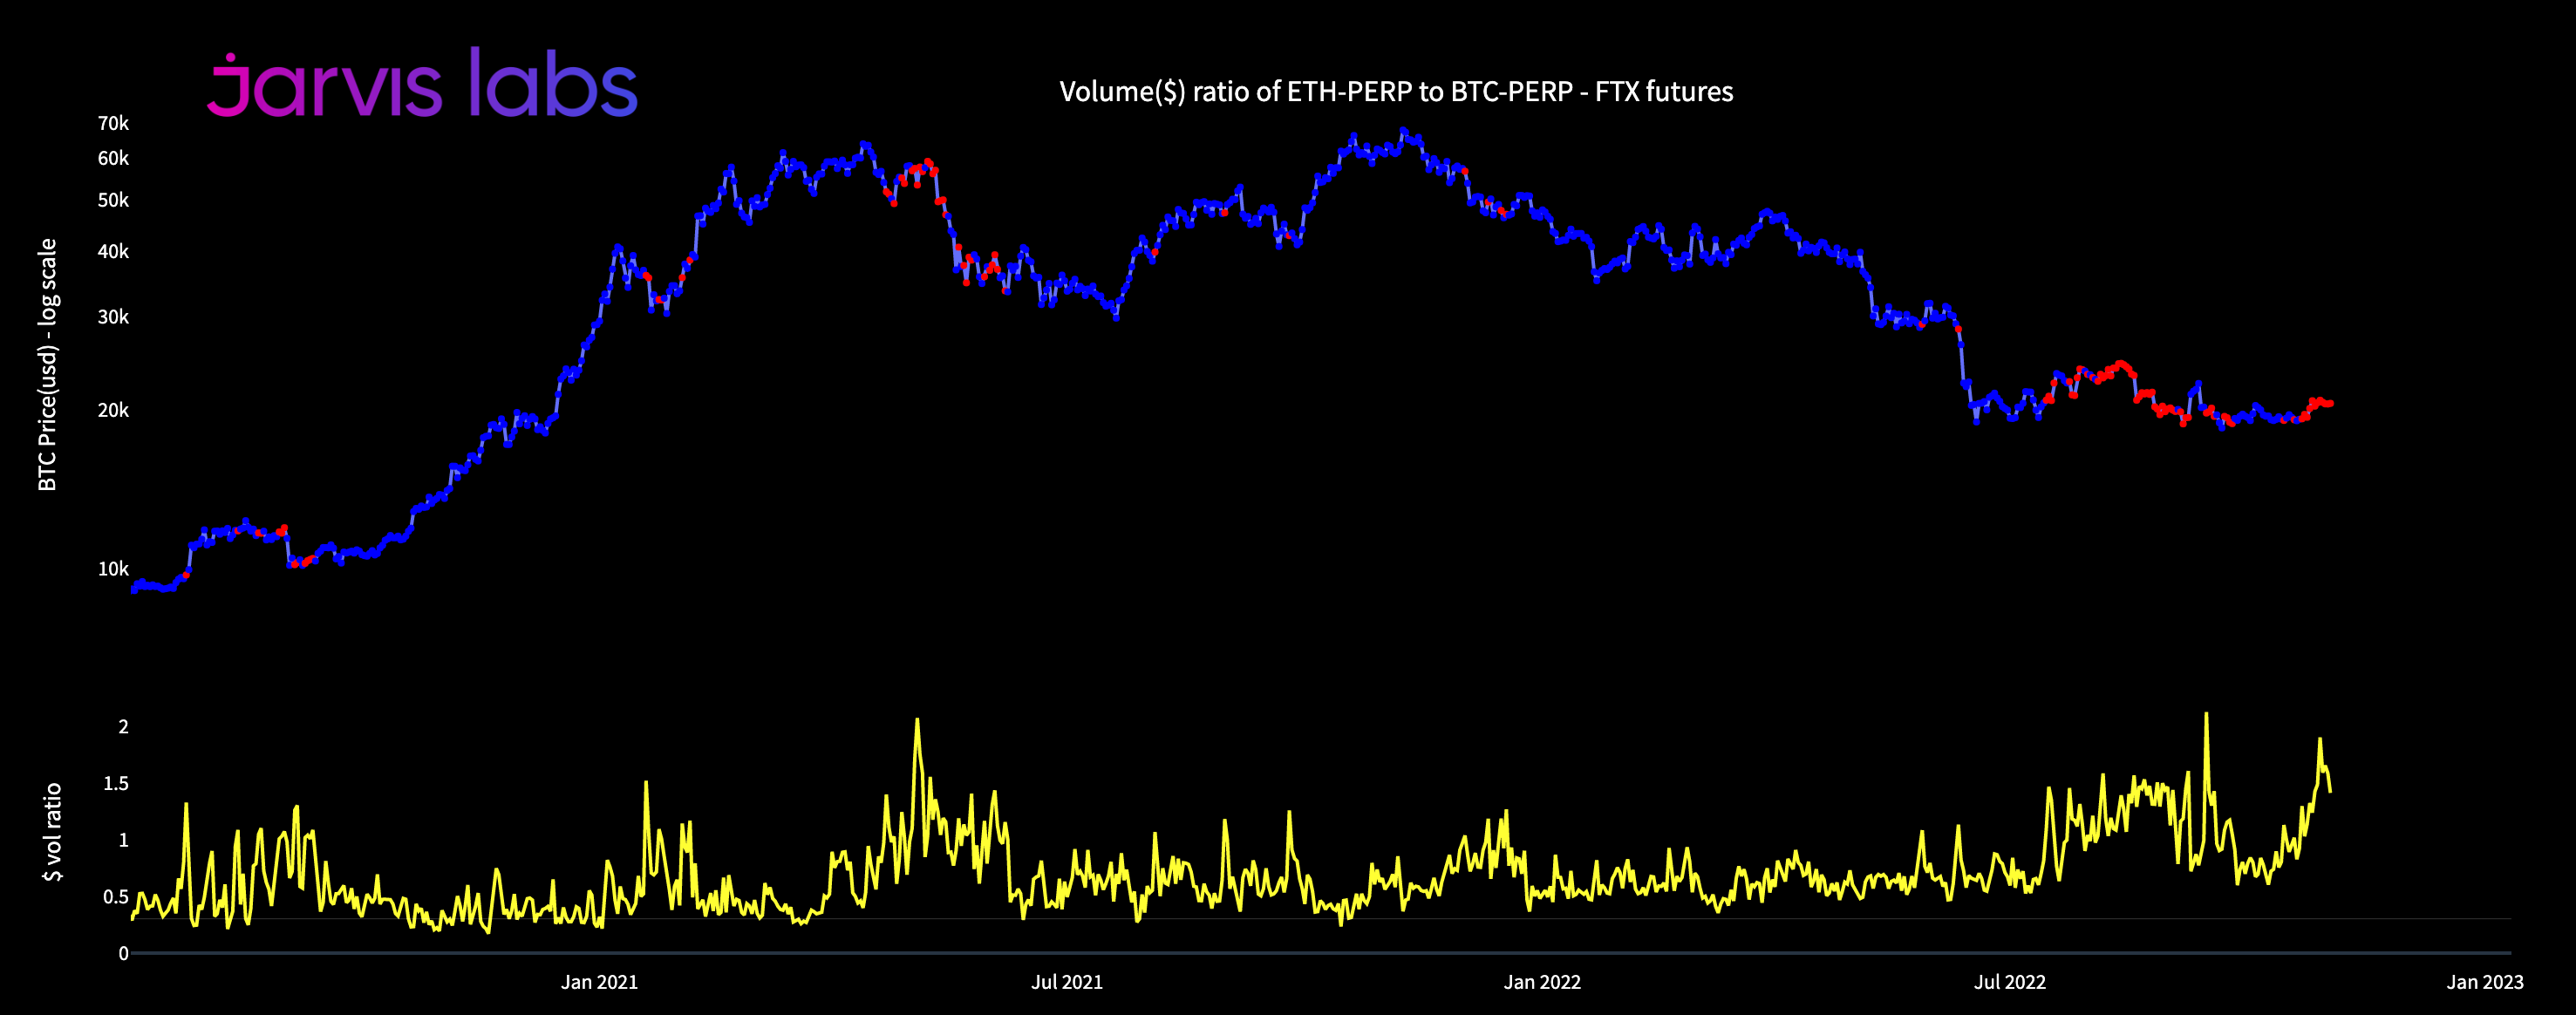
The second point we can dive into is the volume of ETH futures to BTC futures.
The red dots below reflect time periods when ETH volume was higher than BTC volume. This volume difference is an outlier because BTC’s market cap is much greater than ETH’s. And as you can see, when ETH’s volume is running hot, it can act as a warning sign to the market getting ready to cool down. We have red dots of late.
The onchain is not looking great, the futures trade volume is also not great, and now we can look at some technical analysis…
If we pull up the Ethereum dominance chart, we get a third confluence.
Ethereum dominance is a chart showcasing how much of crypto’s market cap is ETH. Right now it’s around 20%. Over the last six months the 20% area has acted as a resistance. It has also seen multiple failed breakouts to date. You can see this in the chart below.
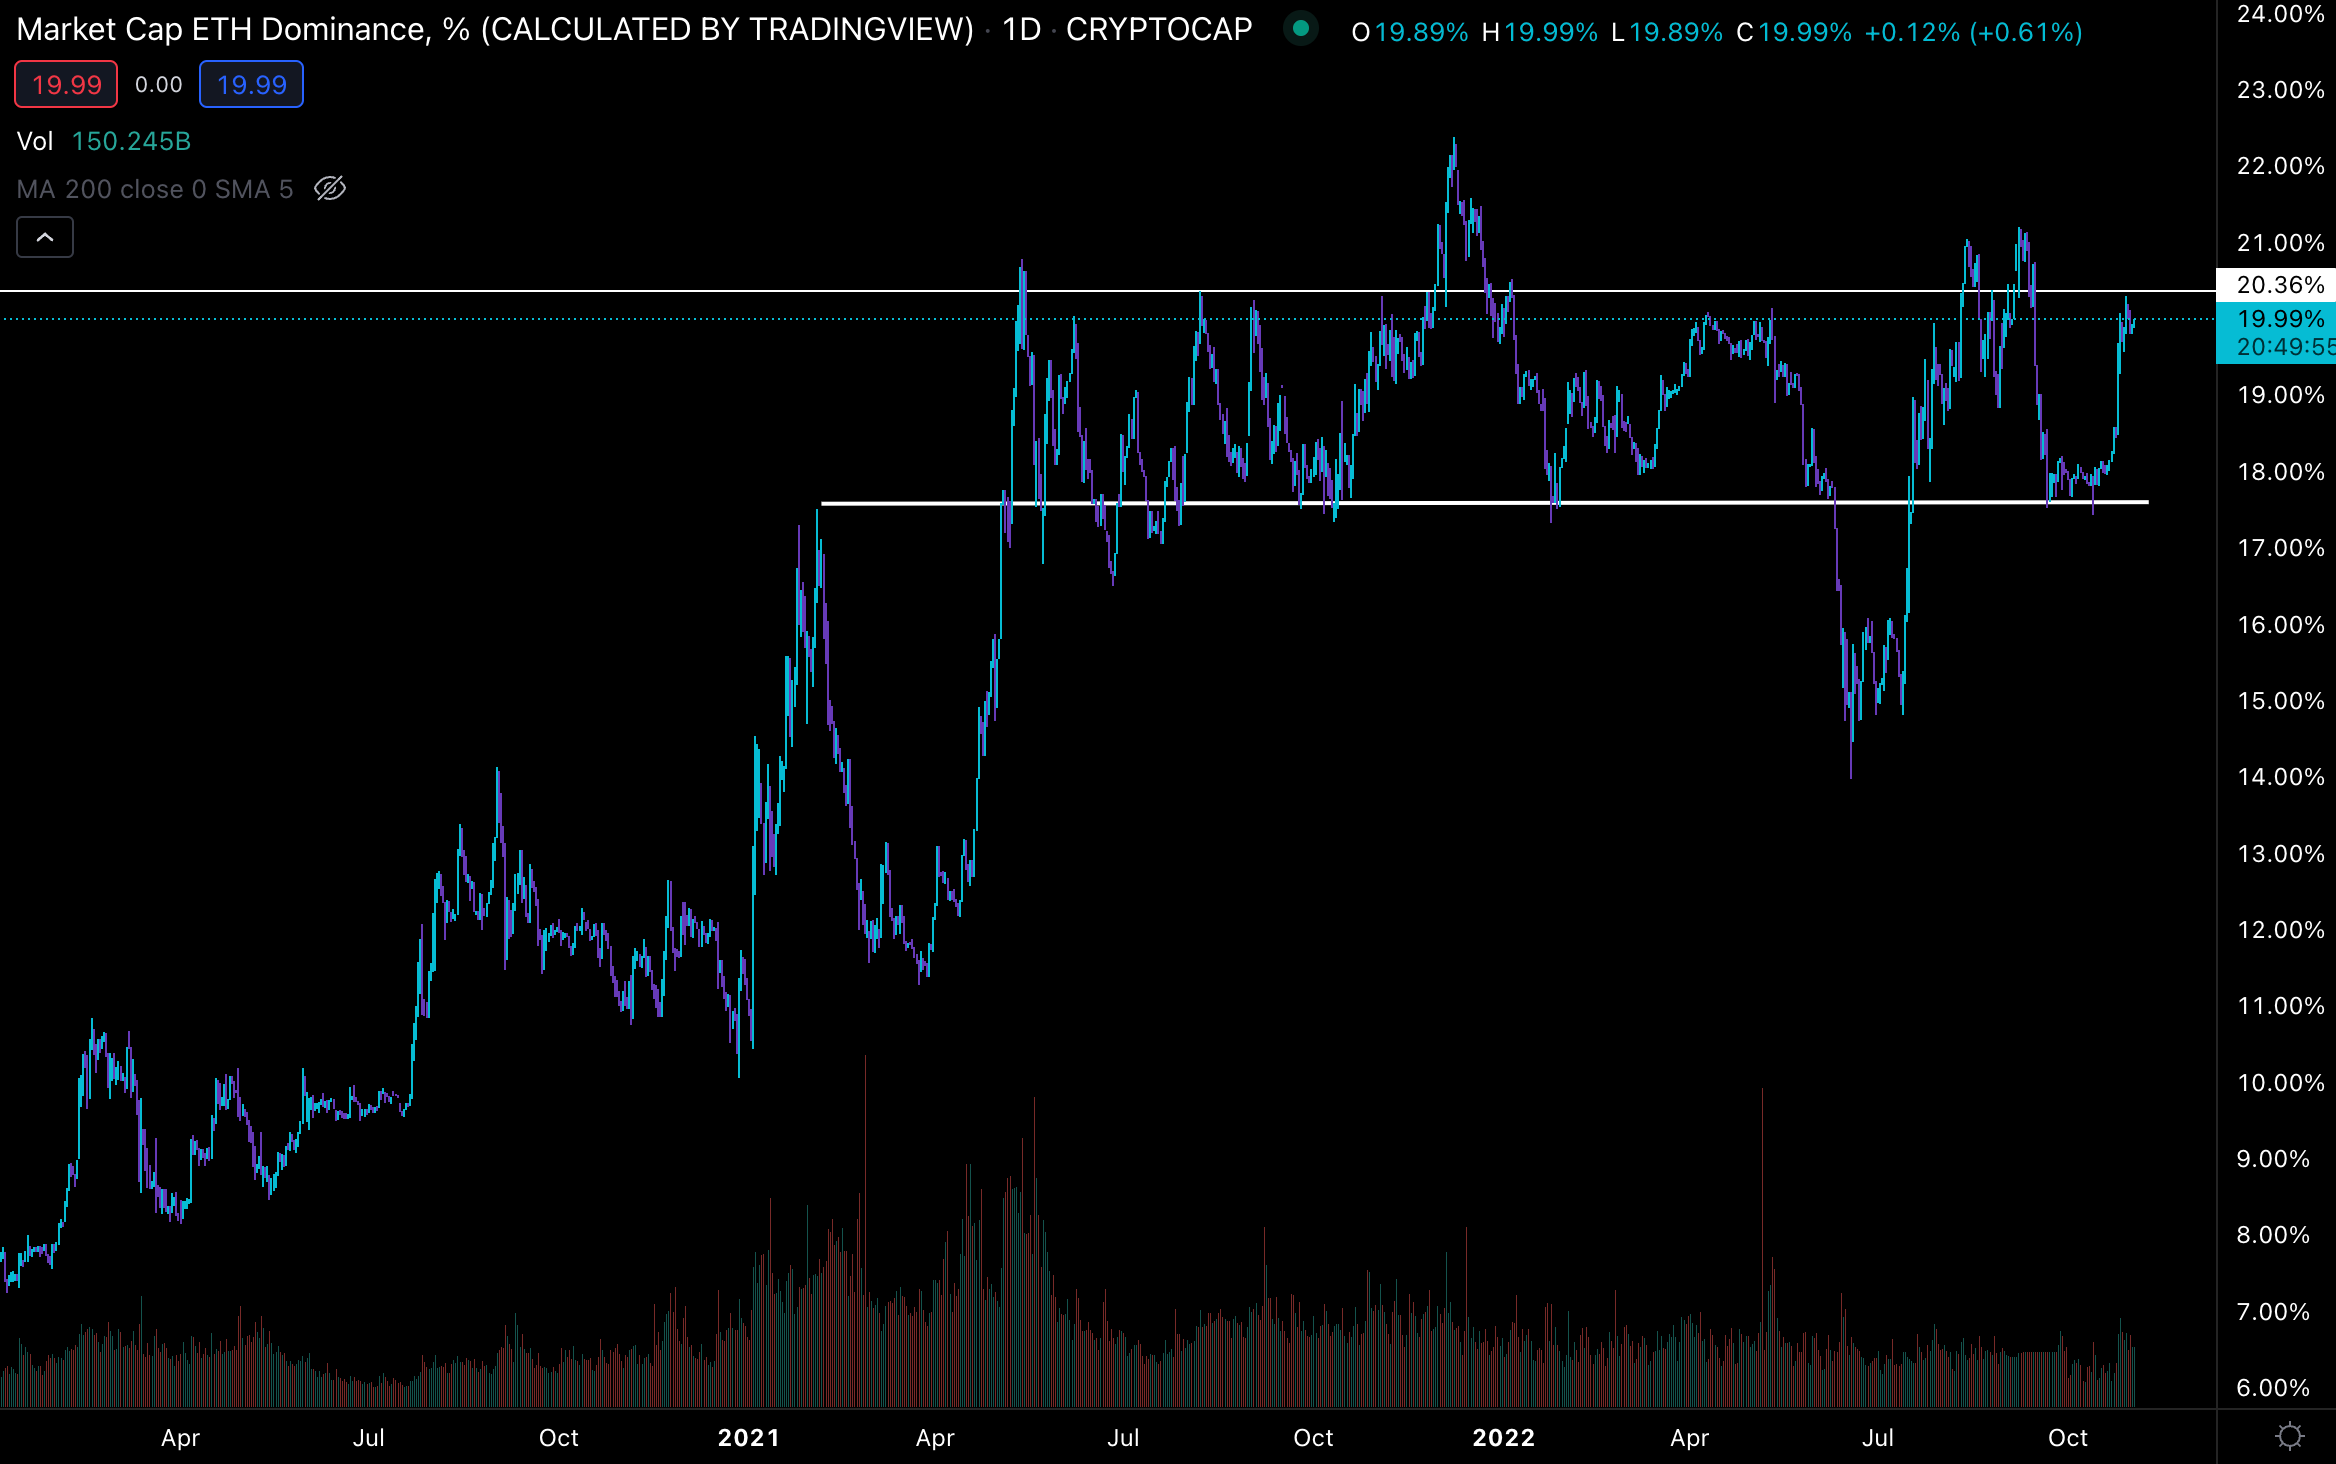
The rejection at this 20% level is notable. That’s because in the first accumulation chart, we see Bitcoin lacking bullish activity. And pivoting over to Ethereum, we get signs that it is not breaking any resistances and it is acting as if bearishness is coming.
Long story short, the three points are alluding to market softness in the week or so to come.
And to add to this is crypto’s relationship to FOMC meetings…
FED Reversals
The next part is best summed up with a table by our very own “FM”. You might remember him weeks ago alluding to impending volatility… A volatility that unfolded in less than 36 hours from the essay.
Anyways, the table touches on all FOMC meetings for 2022. It then looks at BTC’s performance in the seven days prior to the meeting, and then looks at the seven days following. Notice anything?
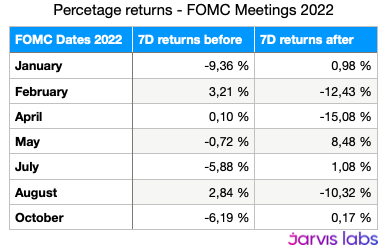
If the time period before the FOMC was positive, the period after was negative. And vice versa.
As we go into the FOMC meeting we're in an uptrend. While it isn’t noteworthy for Bitcoin at 2.5% as I write this… Ethereum is nearing double digit gains.
This outperformance can likely be attributed to the subtle shift in Ethereum’s supply curve as it went deflationary for a bit - we hit on this recently in “Welcome to Deflation City”.
Whether or not that is the exact reason is likely up for debate. One thing that might be more certain is we remain highly skeptical DOGE has entered a new paradigm.
Bubbles still exist, 1+1 still equals 2, and the Simpsons still predict the future.
So unless the FED decides to surprise us all with a rate hike that is less than 75bps (17% likelihood according to CME FedWatch Tool) we can expect this behavior for 2022 to continue.
Until next time…
Your Pulse on Crypto,
Ben Lilly


