Finding Direction
A Guided Market Update


(breathes in… exhales)
I’m back.
It’s been nearly four weeks since I last wrote Espresso.
I’ve missed it…
And in all honesty, my clarity regarding the current state of the market has suffered.
Being away from the regular cadence of publishing market analysis on the daily price movements has left me a bit unsure of myself.
And that probably comes as a bit of a letdown to many of you reading this.
After all, it’s been 26 days since I last wrote Espresso… But who’s counting.
After such a long period away from the daily nuances of the market it might seem natural to think I had an epiphany of sorts. That I suddenly come back here to unload buckets of alpha, ready to be soaked up by the most ready readers of this post-hiatus piece.
Sorry to disappoint.
But then again, just like any trader who is presented with unexpectedness, an opportunity can be found.
My current state of lacking clarity is an opportunity.
The lack of confidence and current hesitation I have while typing away presents a great moment to walk you through a thought process on how to get re-oriented on the market.
So instead of taking a day and working out my thoughts before writing, I decided to get familiar with the market again right here as I type out Espresso… For better or worse.
For some reason I think it might prove helpful to see how an analyst starts to make sense of what seems like chaos.
Perhaps that’s worth a shot glass of alpha. And even if done poorly, we can still learn something.
So in a moment, I’ll break down some metrics and data points regarding the market. Then lay out what needs to happen for certain scenarios to unfold. And possible opportunities we can watch out for.
This will help us over the coming week or so regain the pulse of the market before making moves.
But before doing so… You are probably asking…
Ben where the hell have you been!
Well, some of you have written to me via Telegram, Twitter, and through email. And some of you made Benjamin worry that you were worried. Questions I’ve heard varied from concerns that perhaps I was leaving the crypto scene. That I took an offer I couldn’t refuse. Or Jarvis Labs was silently backing away from crypto.
This could not be further from the truth.
For anybody that has built a company in crypto they likely understand some of the hurdles my team and I have faced as of late. And for perspective, I’m not talking about writing a smart contract that promises an innovative way to farm a worthless token…
But a real entity built for the long-haul.
It means hiring lawyers, talking to accountants, some globetrotting, more lawyers, discussions with regulators from various countries, tweaking future plans to satisfy everybody, and did I mention the lawyers?
It is an exhaustive process to say the least. But one that the team is starting to feel like is more behind us than in front of us. And the promise and excitement that comes with rolling out an entity that will make a name for itself.
Which is to say, no chance anybody can sway us from doing what we are doing. Nor will this team quit.
Instead, I spent a bit of time decompressing before the next leg… And am now pumped to be writing Espresso again.
I won’t give away what is in the pipeline quite yet. I know I’ve mentioned ChainPulse to everybody before, but it is much more than that. And there will be plenty of time to discuss it when the time is right.
For now, let’s get to what matters today…
Market Update
First up is trying to figure out what the market looks like through the lens of the king of crypto, bitcoin.
From a macro perspective we can take a look at our bull/bear index. You can see it below. Pay attention to the indicator on the bottom. When the orange line - “Fair Value” - is below the blue line it is bearish.
The orange line dipped before the big drop in May and has yet to fully recover. It is showing a bit of strength recently, but still has some ground to cover before bitcoin is in a full blown bull market.
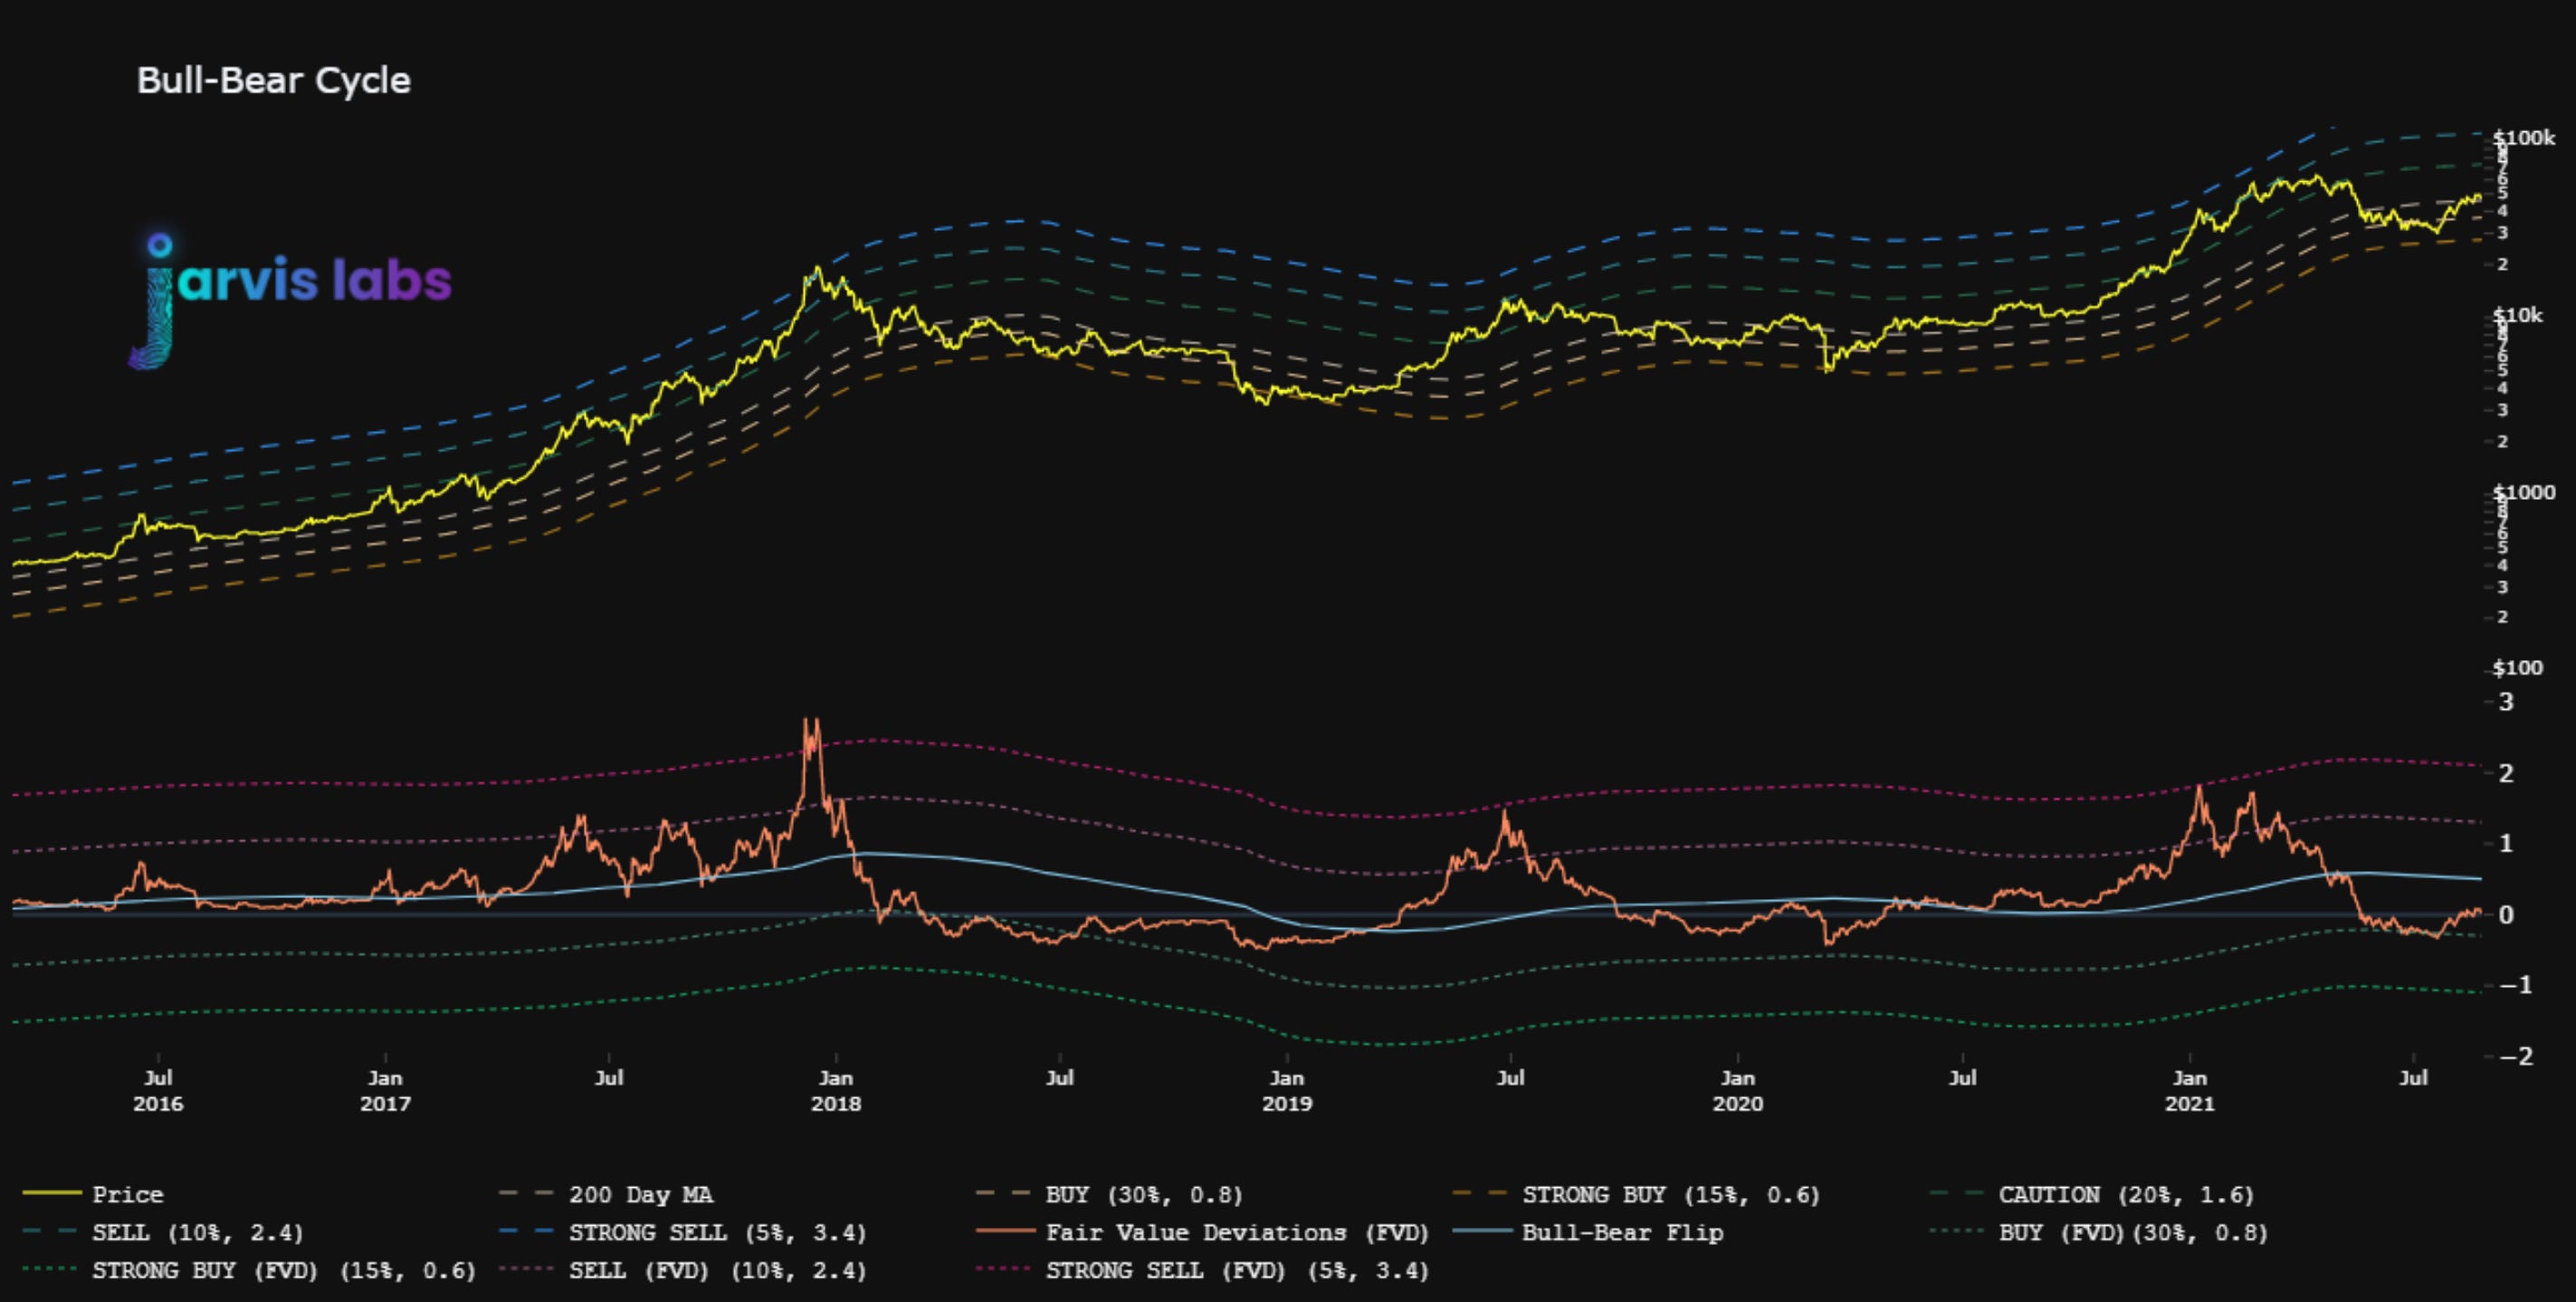
This chart also pairs up with the simple MACD indicator on a daily price chart. It’s a fairly common momentum indicator which is starting to form a bearish crossover. I like to use it when the market feels overextended… It’s never good alone, just a simple way to help gain an understanding.
As you can see in the chart below there was bearish price action after the following succession happened: The MACD moving averages showed considerable strength, then dipped below the mid-line, and then recovered only to have another bearish crossover downwards.
The white vertical line shows when the third part of that succession took place - the last bearish cross. The bull run of 2013 shows some of these characteristics, but its not as clear as recent times.
What I find interesting here is it coincided with the last attempt of reclaiming a new high. Which means if bitcoin fails to make a new high in the next month we might be in trouble.
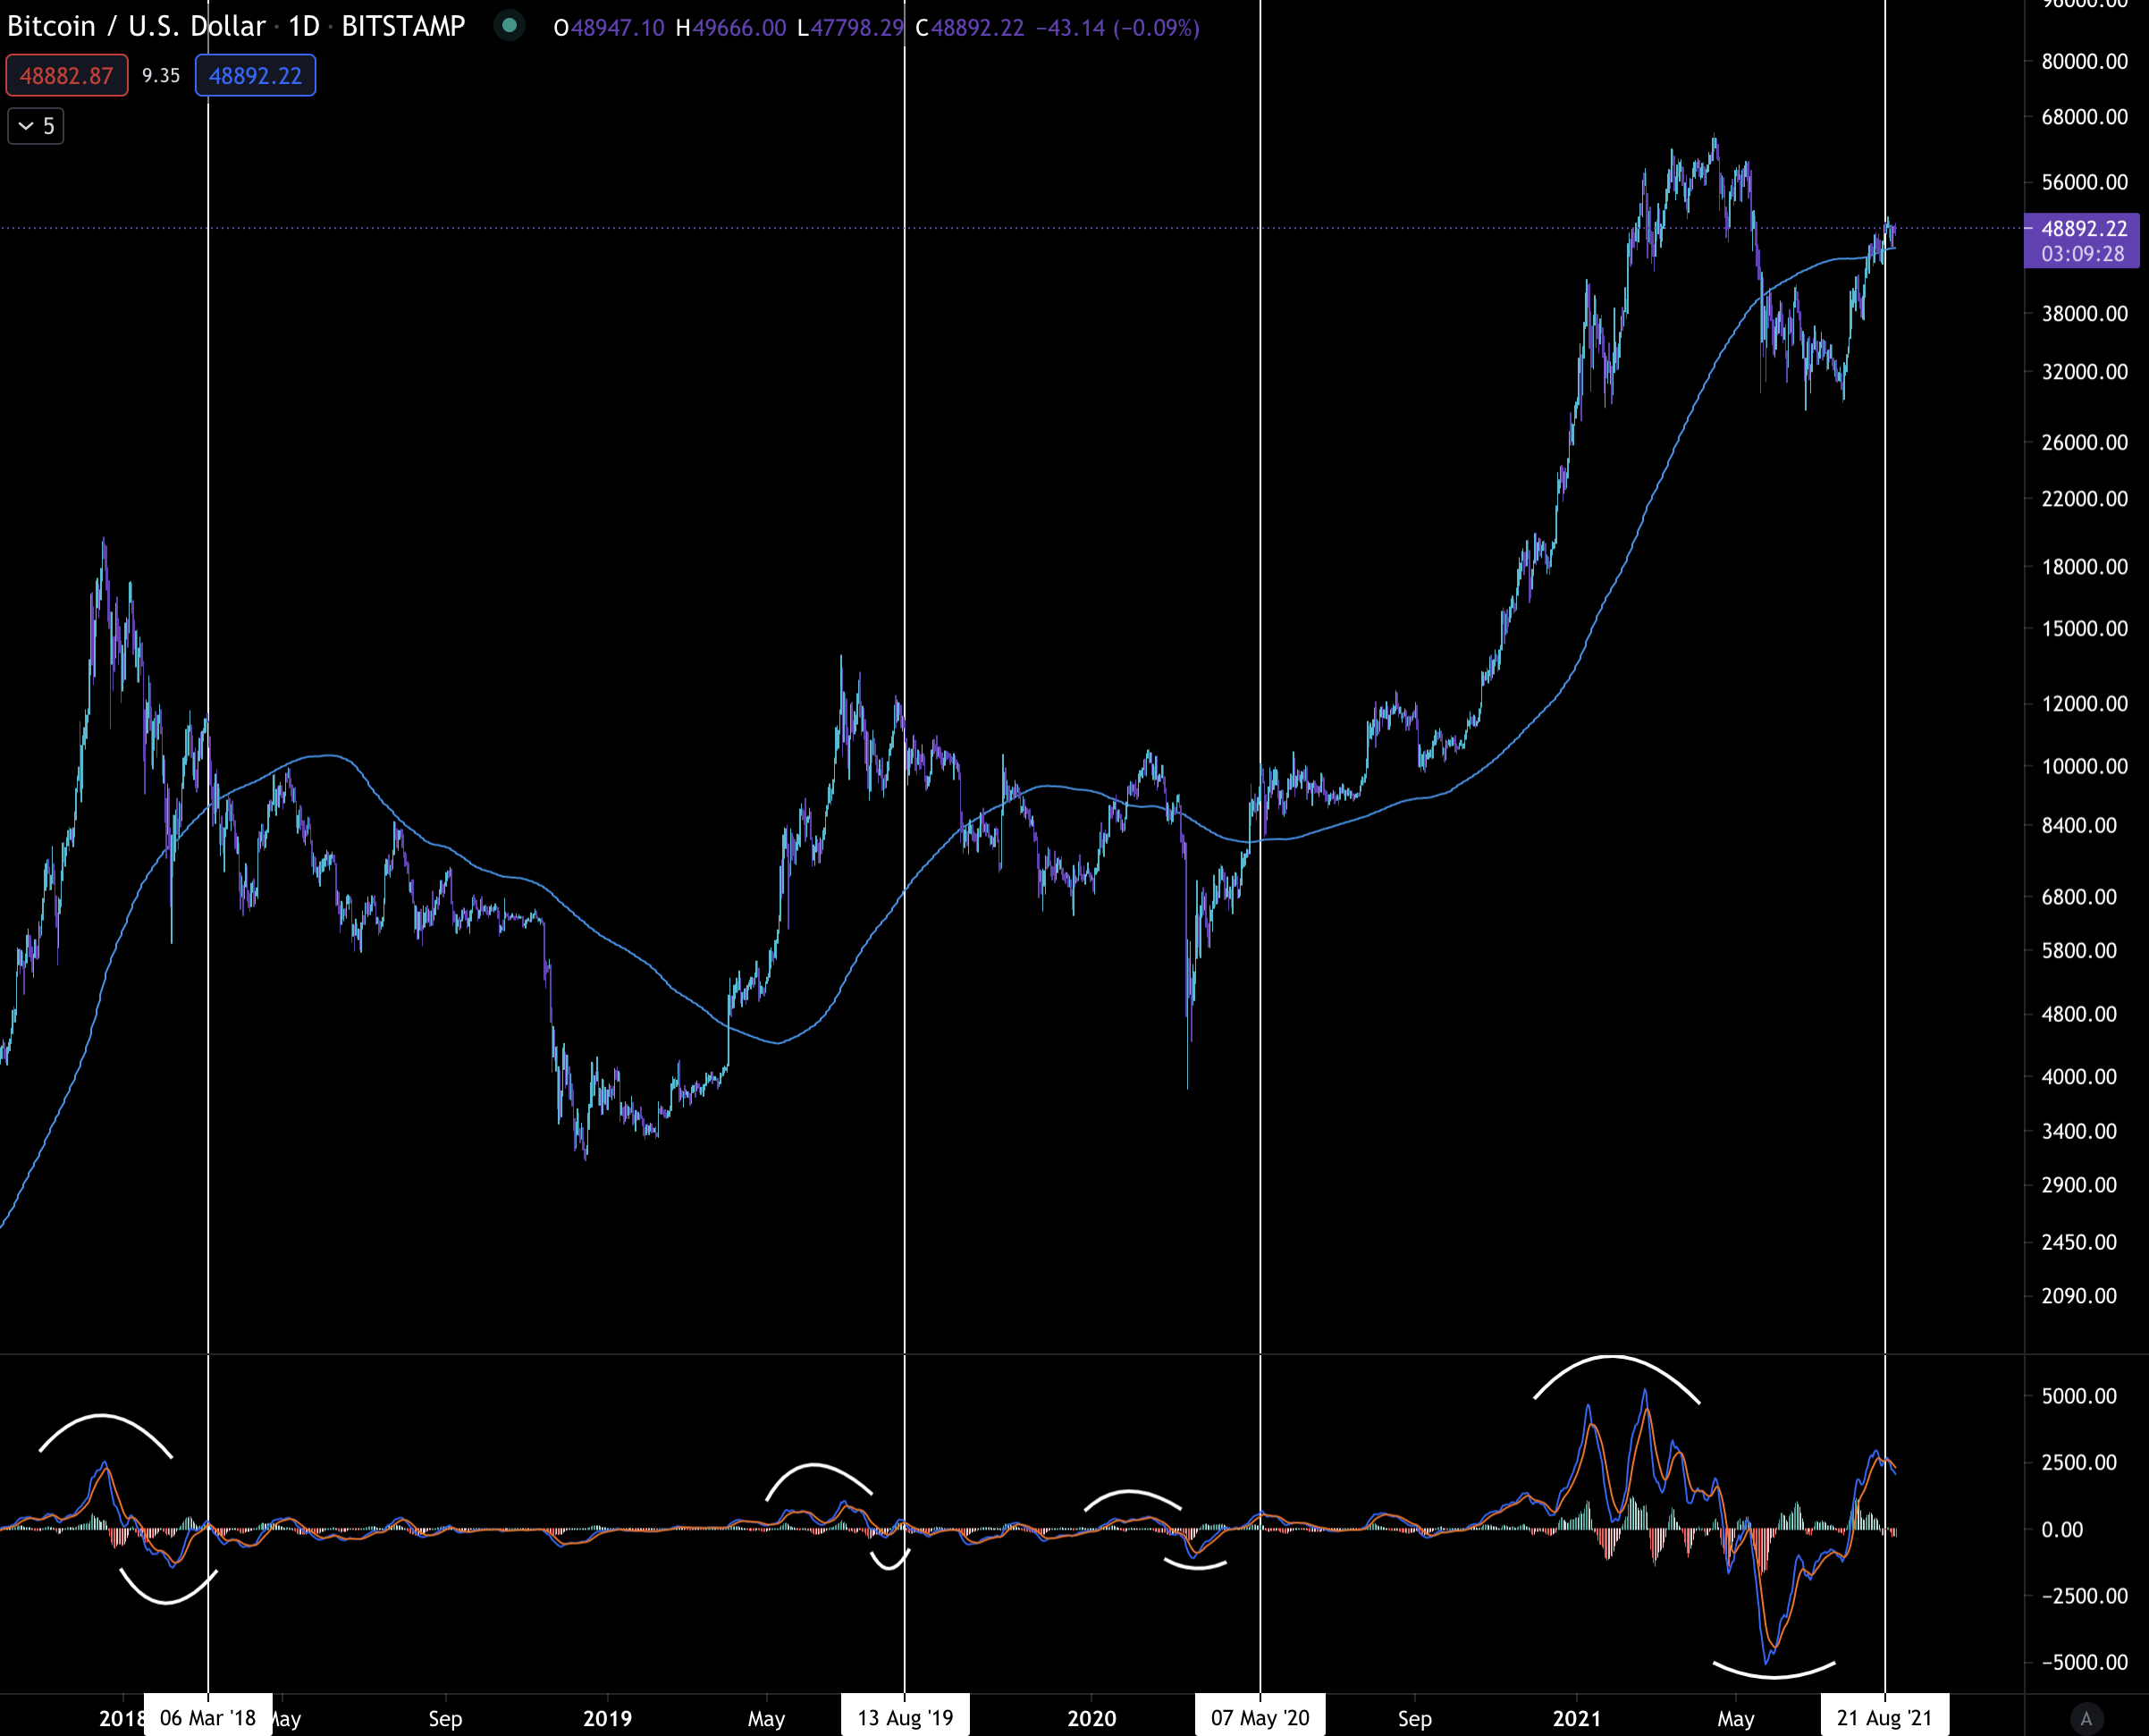
Looking for some bullishness… bitcoin is showing some strength in finding support above its 200-day moving average. That’s the blue moving average in the chart above.
In 2017 and 2018 price paid a lot of respect to it. However, in late 2019 there was a similar drop below, slight rise above similar to what we see today before hitting new lows… This gives me some more bearish feels if we retest the 200d MA in the coming weeks.
Again, another feather in the cap for bitcoin needing to advance towards that ATH sooner rather than later.
If price does test the 200d MA in the coming few weeks and shows strength, I’ll feel bullish moving forward and look for the MACD to continue advancing higher similar to what happened in late-2020.
That’s a quick Macro take on bitcoin with some onchain and technical analysis.
To sum it up, the market is not convincing me a new ATH is in the cards right now. I would like to see bitcoin stay above the 200d MA. And if it does retest it, I’d like to see a strong bounce off it to at least $53k.
Now, moving on to some more detailed metrics for a more short-term look…
One of the more recent things our team has been looking at is classic monetary theory in crypto. This is like savings rates, velocity, economic growth, etc. It’s the sort of thing you learn in school, quickly forget, then suddenly realize is relevant again in crypto.
One metric I find pretty interesting as it ever so slightly relates to these variables is how price responds to circulation.
Circulation is basically the percentage of supply changing hands. It is similar to velocity… but also not. The difference from velocity is that circulation does not measure how many times a token is transacted, but simply measures in a binary yes or no manner whether a token changed hands.
If one BTC hits five different wallets in a day, its a ‘yes’ for circulation on that day.
In this manner it tells us the percentage of the supply that is moving around - a proxy for how liquid a token is.
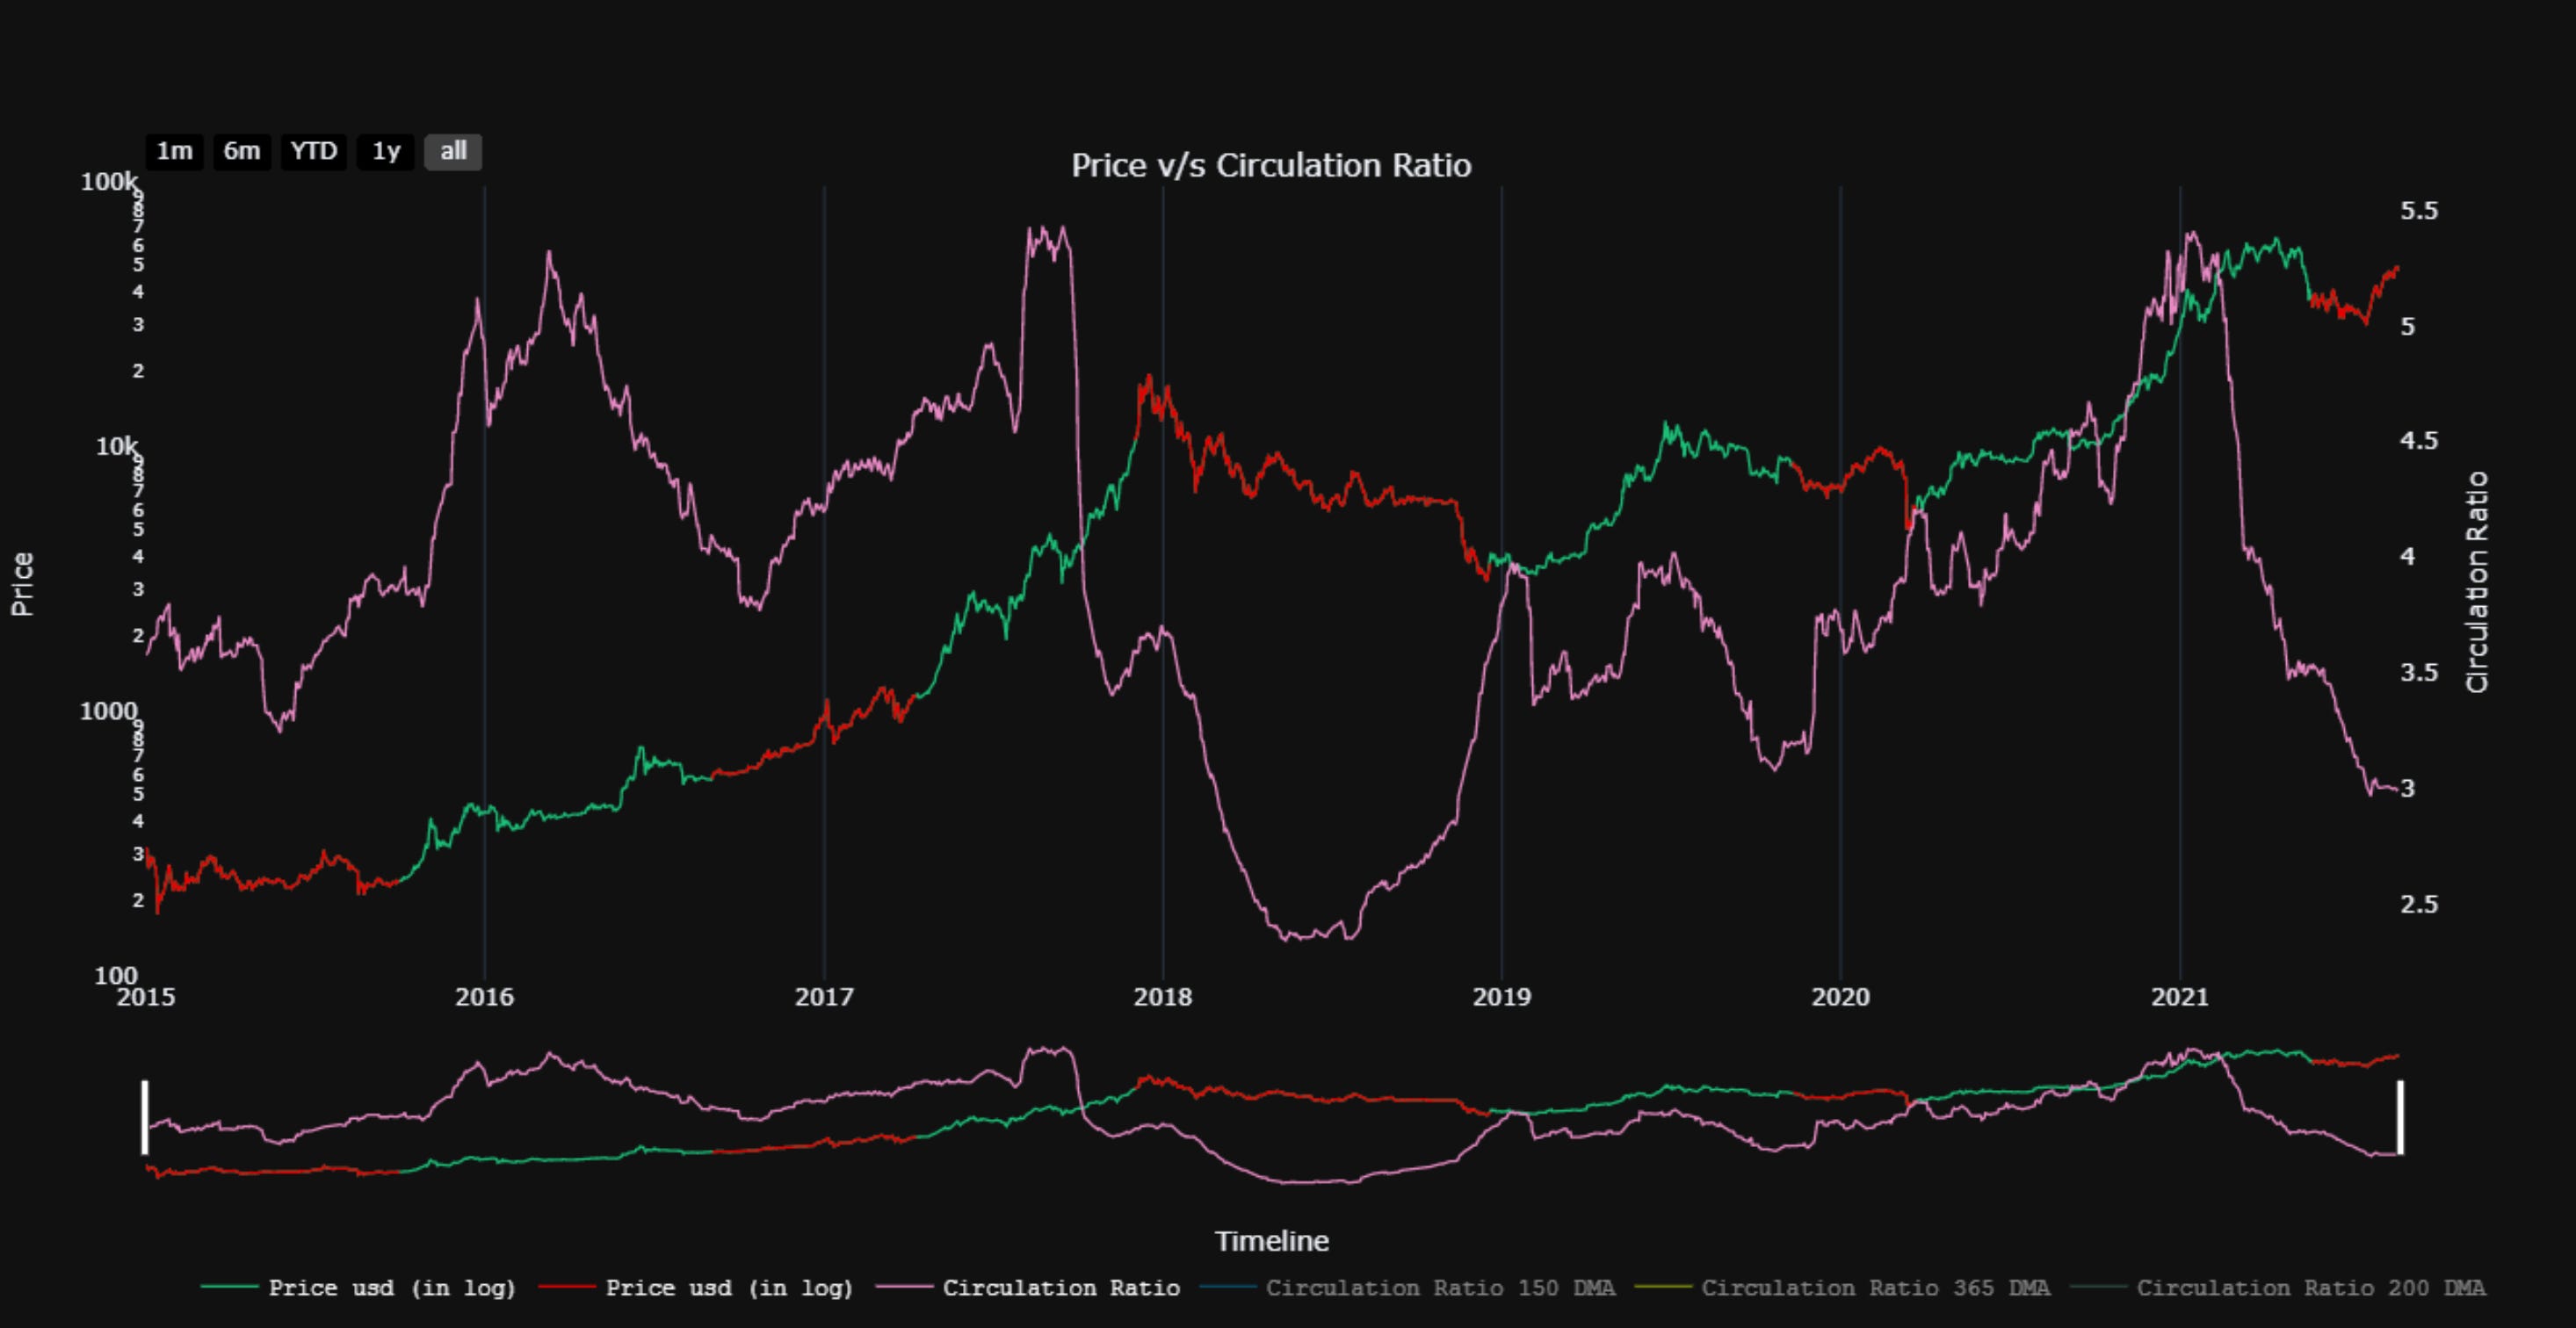
To dial in circulation and find a signal we ran it through a model.
Pink is the ratio we came up with that helps create the model… The green/red line is the interpretation in terms of when to buy or sell.
Right now the model is showing bearishness.
Hopefully we can come across a bullish sign soon as I’m starting to get a bit depressed writing about all this bearish stuff…
So, here we are starting to get our hands dirty and a lot of what we look at is starting to look bearish. Usually when that happens I’ll ask myself how far this market can continue in its current direction if things are signaling the opposite of what the market is doing.
To answer this question the first thing I look at is funding rates.
The current bullish advance from $30k to where we sit at today is done with funding rates staying at sane levels.
Hmmm not what I expected. I expected to see that things were overheated and the market was trading with reckless abandon.
To understand what I mean, back in March and April funding rates were getting irrational. Traders holding long positions were paying over 100% annually to keep a position open.
That’s just insane. In fact, I remember seeing 3-400% funding rates at one point. Meaning if price didn’t climb nearly 10% in a week, a trader was losing money.
It went on for quite a while before we got a full reset on funding rates in June. With funding rates staying below 0.01 (or 10% on an annual basis) today for long positions, this means the market is not getting irrational here.
It also means cascading liquidations are a less likely outcome than what we saw in May.
So unless somebody unloads tens of thousands of bitcoin on the market it will be tough for the price of bitcoin to take a massive one day cut simply due to liquidations.
So in terms of funding rates we are at a goldilocks level… Not to hot, not too cold… Room to keep marching higher. And it also means the futures market is not pushing things higher… But likely spot.
And because it is likely spot the next question is - what type of wallet is moving the market higher? Is there an accumulation trend at play?
To start figuring this out, I’ll pull up our accumulation trend metric.
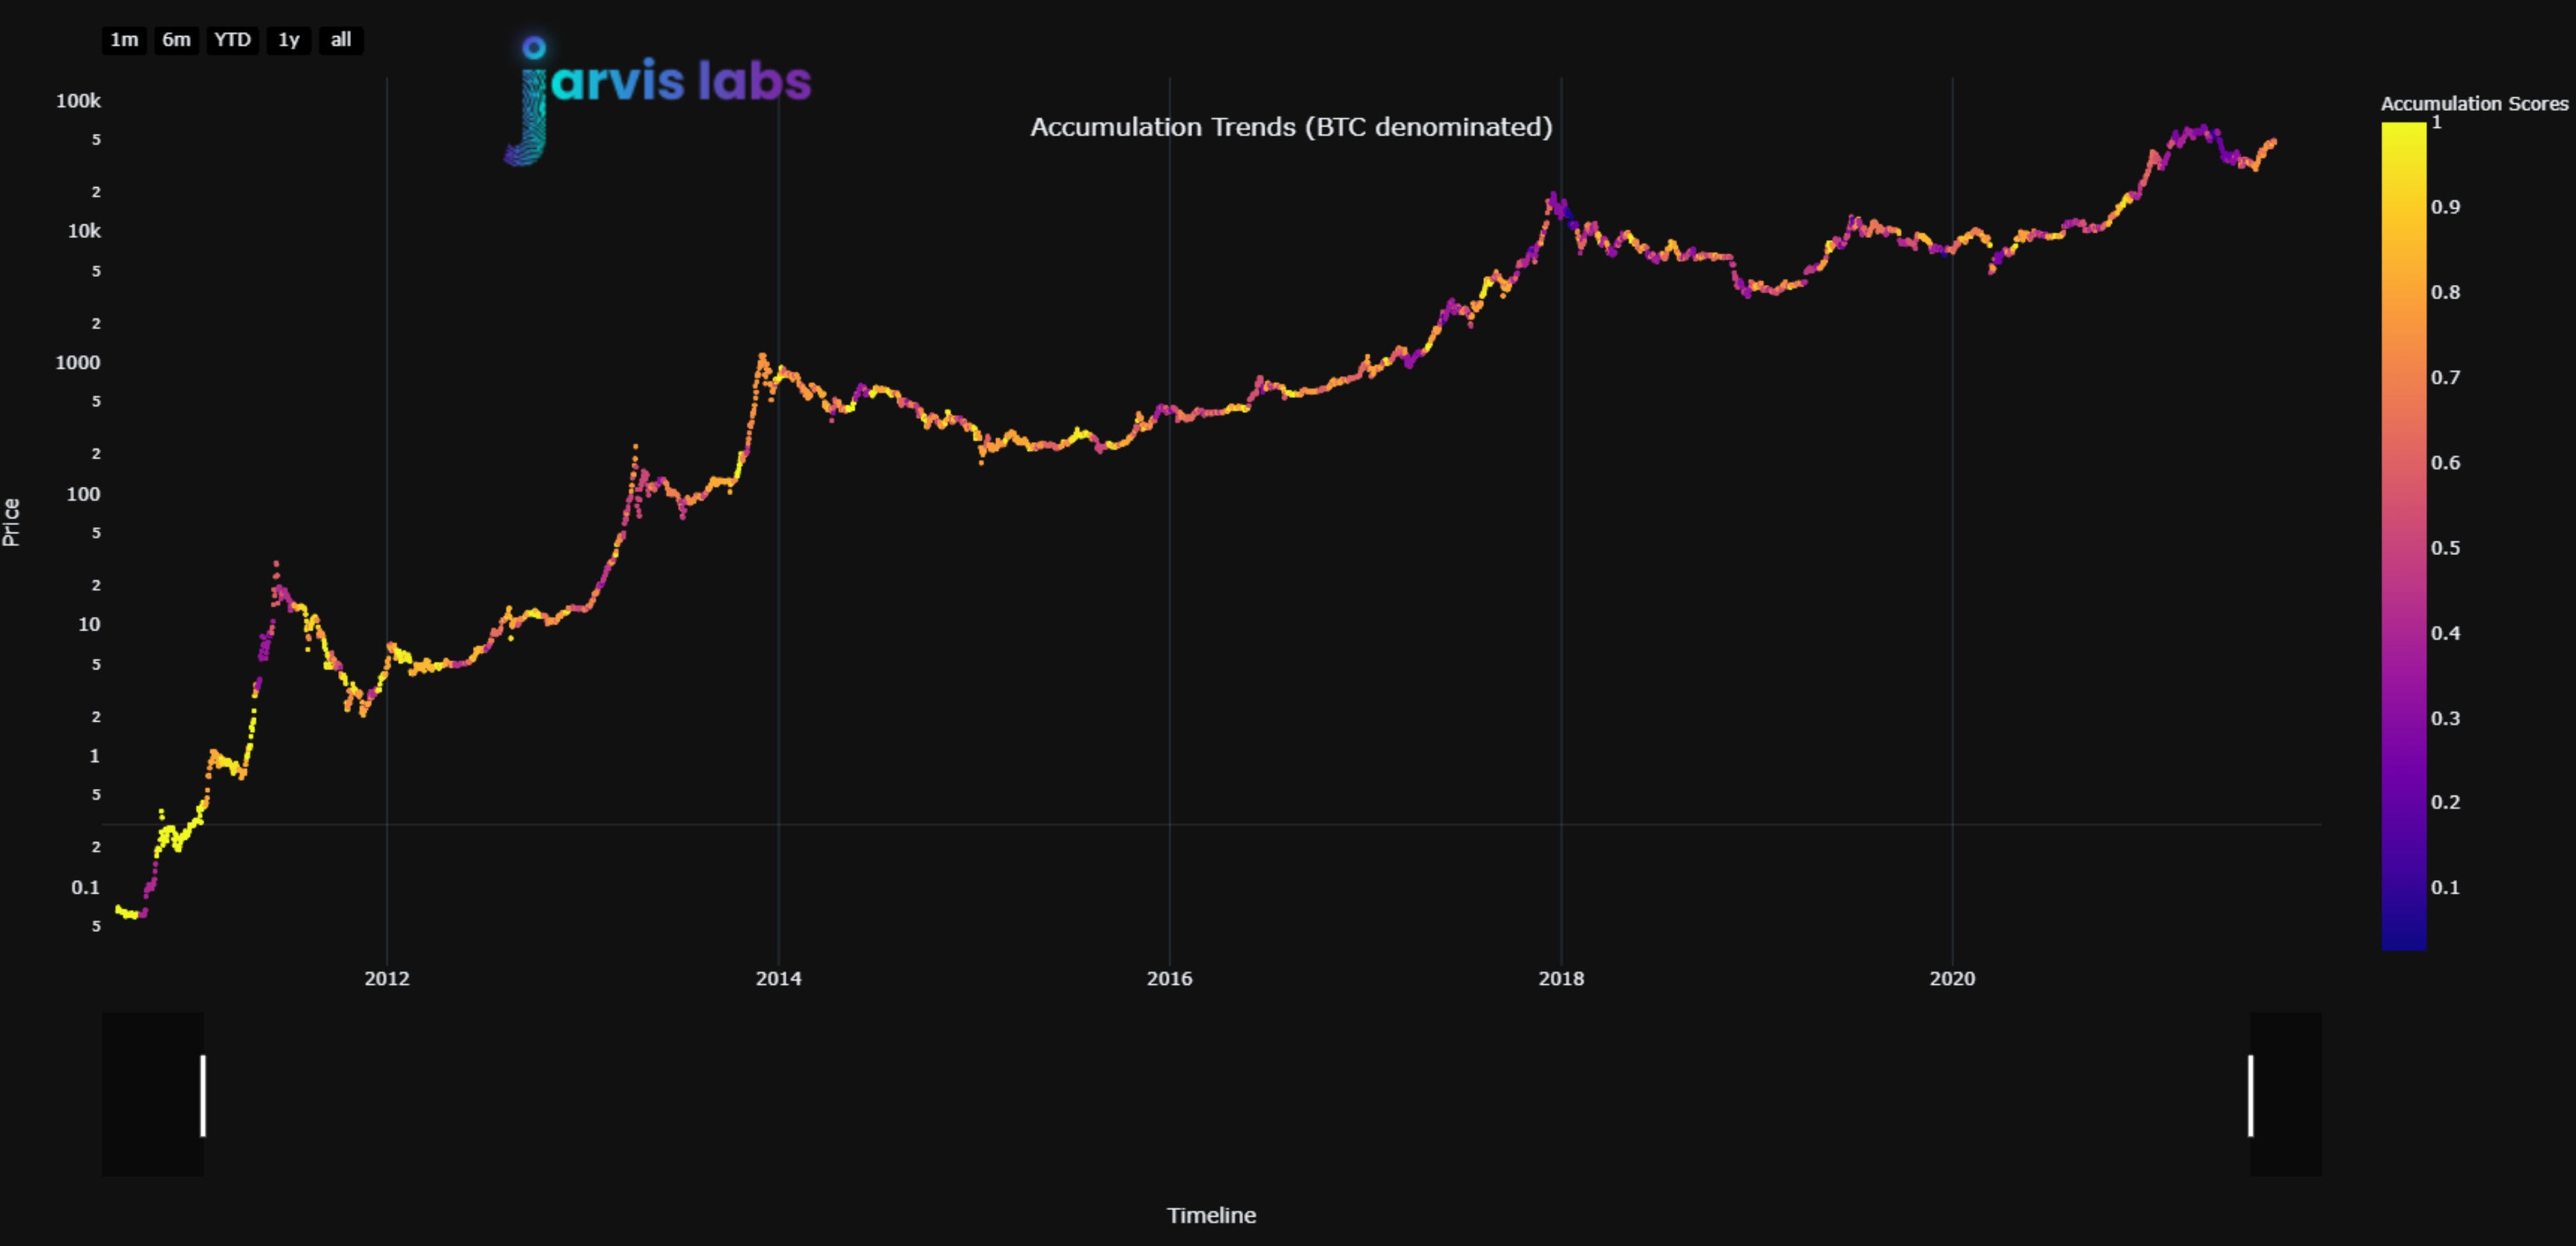
The chart below shows who is accumulating on a 30 day span - whales versus shrimps. The more yellow and closer to 1 the reading, the more that whales are accumulating. The closer to purple and 0 the reading is, the more shrimps are buying.
Its sort of as expected in February, March, and April with a lot of purple happening. Shrimps/small buyers were stacking BTC. They continued even after the big drop.
What’s interesting here is we got a flash of yellow right around the $29k dip and continued accumulation from larger wallets as price bounced from the dip. This is telling since it indicates larger wallets were accumulating into the dip and after - remember this is a 30 day measurement.
The most recent data point is 0.48, meaning its midsized wallets over the last thirty days. If this starts to trend down near 0.3 I’ll get bearish on this. For the moment we can use this as confirmation that larger wallets were moving price on spot. AKA we are getting closer to the pulse.
So, to pause for a moment… Larger wallets bought near $30k and are buying less based upon the current accumulation score.
Since we see that market movers - surprise surprise - are moving the market, let’s check out our onchain Feeding Grounds (still need a better name). This chart tells us when larger wallets are making moves in terms of support and resistances.
The blue dots indicate either buying or selling (we can’t give away all our alpha!) while the green and red lines indicate support or resistance based upon price history.
What stands out first to me is the accumulation taking place in July. There is a flurry of blue dots… And based upon the accumulation trends chart earlier, this is further confirmation that larger wallets were accumulating.
Meaning whales are the players to watch.
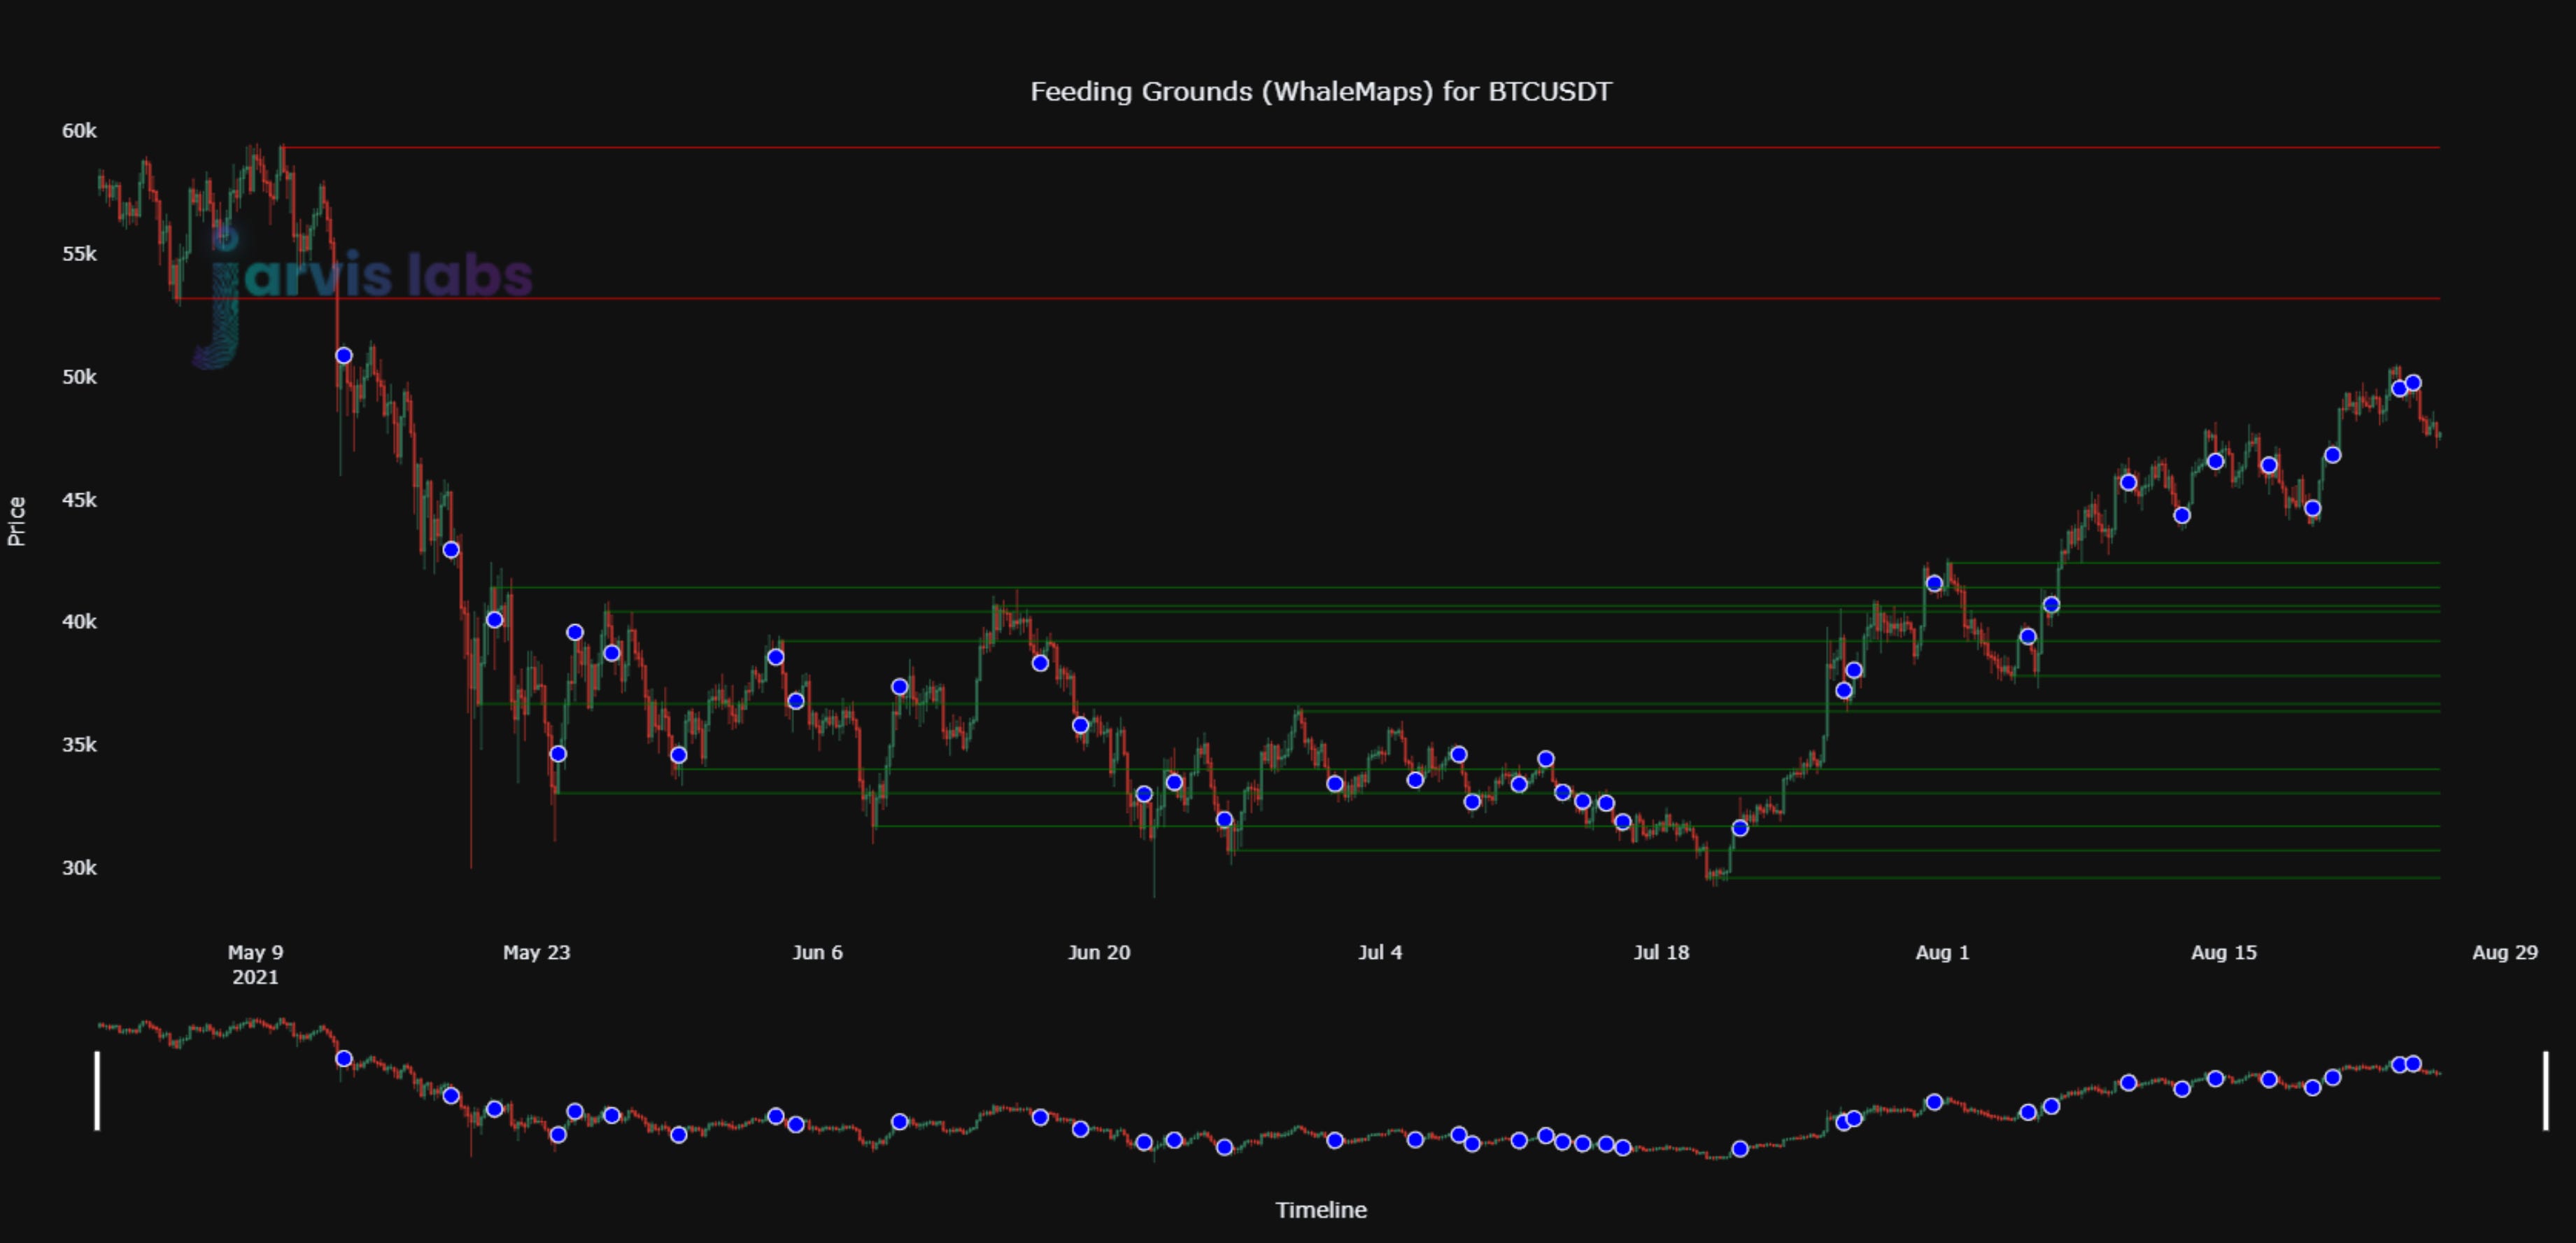
We also know that there was a hefty sell at $42k on August 1st and a few more last week.
Additionally, there was some buying taking place when price dipped. Hmmm conflicting signals here.
So how to interpret?
There is a bit of a war going on to control the trend. It’s a war between large wallets.
Thus, the key right now is to follow both the bull and bearwhales… One of them will win here, and whoever does will dictate the trend moving forward. And the going back to the Macro take, it feels like the next few weeks will determine the winner.
Discussion
Now, I understand there wasn’t much alpha here. I basically just spewed out a bunch of bearish nonsense as the market rips higher. But the takeaway here is that larger wallets were accumulating near $30k. And while some have bailed, some still want the market higher.
Now we need to dig further into these two warring parties.
But before I leave you for the day, I have to areas of the market I want to explore further in order to find a signal…
The first is best summed up with a quote.
“Over two-thirds of all Tether minted across multiple years went to just two crypto companies — Alameda Research and Cumberland Global — sources familiar with the matter exclusively told Protos.”
Consider this, FTX as of late last week held over a billion USDT on its exchange. Its market maker is Alameda Research. FTX just closed out a massive funding round with large enough players, an indication that it is looking to go public. And Sam is making the rounds on camera almost daily - major kudos to him as I know I would never be able to grind like him.
The team has an incentive for the market to be strong if they look to go public.
My other hypothesis which I’m more excited about because it is one we can actually explore later is the NFT trend.
NFTs are on fire, and they will remain on fire with a strong market. If the market takes a hit, scissors and rocks will not be fetching a hundred thousand dollars.
While the FTX story is conspiracy-like, which I don’t particular like since it’s hard to confirm and I tend to believe FTX/Alameda would not abuse a market like this based upon my previous dealings with them… The NFT question is one we CAN dig into.
And I also find it 1) more worrisome and 2) more likely. But more on that later as we continue our pursuit for the market signal.
Until next time…
In Search of the Pulse,
Ben Lilly
P.S. - As I mentioned before, we are not going anywhere. There is a lot that we look to build out over the next four years. That’s how long our current roadmap is - 2025.
Here’s a sneak peek of the first item on our roadmap. It’s the homepage for our new website and consumer facing product, ChainPulse.
We are already at work on the second and third website.