Ethereum's Rusty Cage
Notes From the Lab: What ETH needs to escape the bear market

Bear markets are torture.
For months on end prices give the illusion of strength and consolidation, only to let us down by collapsing at the first sign of resistance from sellers.
It constantly feels like markets are trying in vain to climb their way out of a dark and endless pit.
In fact, that’s the exact thought I had while watching The Dark Knight Rises this past week (I’ll sometimes stay late after cleaning The Lab and watch movies on our state-of-the-art LaserDisc player).
If you’ve watched the film you likely remember the particular scene I’m referencing. In it, Bruce Wayne (Batman) trains relentlessly to break free from Bane’s prison, but time and again his attempts to escape fall short, and each effort leads him back deeper in the pit than before.
High hopes, quickly dashed.
Not so different than the current bear market price action – especially in regards to Ethereum (ETH).
Just like Batman in Bane’s prison, during bear markets prices will time and again strengthen below resistance, then falter when it matters most and come crashing back down to the lows after each miniature rally. And that’s what we’ve been seeing recently from ETH.
Eventually, we know ETH will escape, just as Bruce Wayne did. And that will begin a new bull market. But how long will it take?
Today, let’s take a look at a few important technical and on-chain metrics that can eventually help guide ETH prices out of their hopeless pit.
History Repeating Itself
While thinking on how ETH could break out again, I was reminded to revisit this old thread from Jarvis’ co-founder and head quant, Mr. Benjamin. He wrote it back in July when ETH’s bear market rally was reaching euphoric levels.
In the post, he discussed how caution was a must, and he shared this fractal highlighting the importance of ETH’s ~$1,700 price level.
Another look at the same chart shows more symmetry
— JarvisLabs (@Jarvis_Labs_LLC) 8:41 AM ∙ Jul 15, 2022
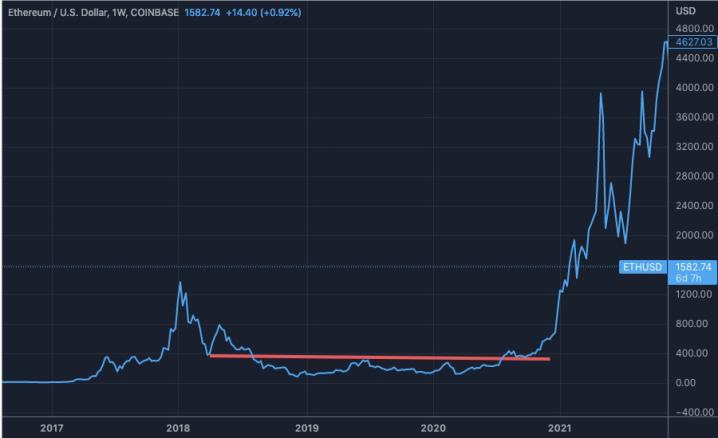
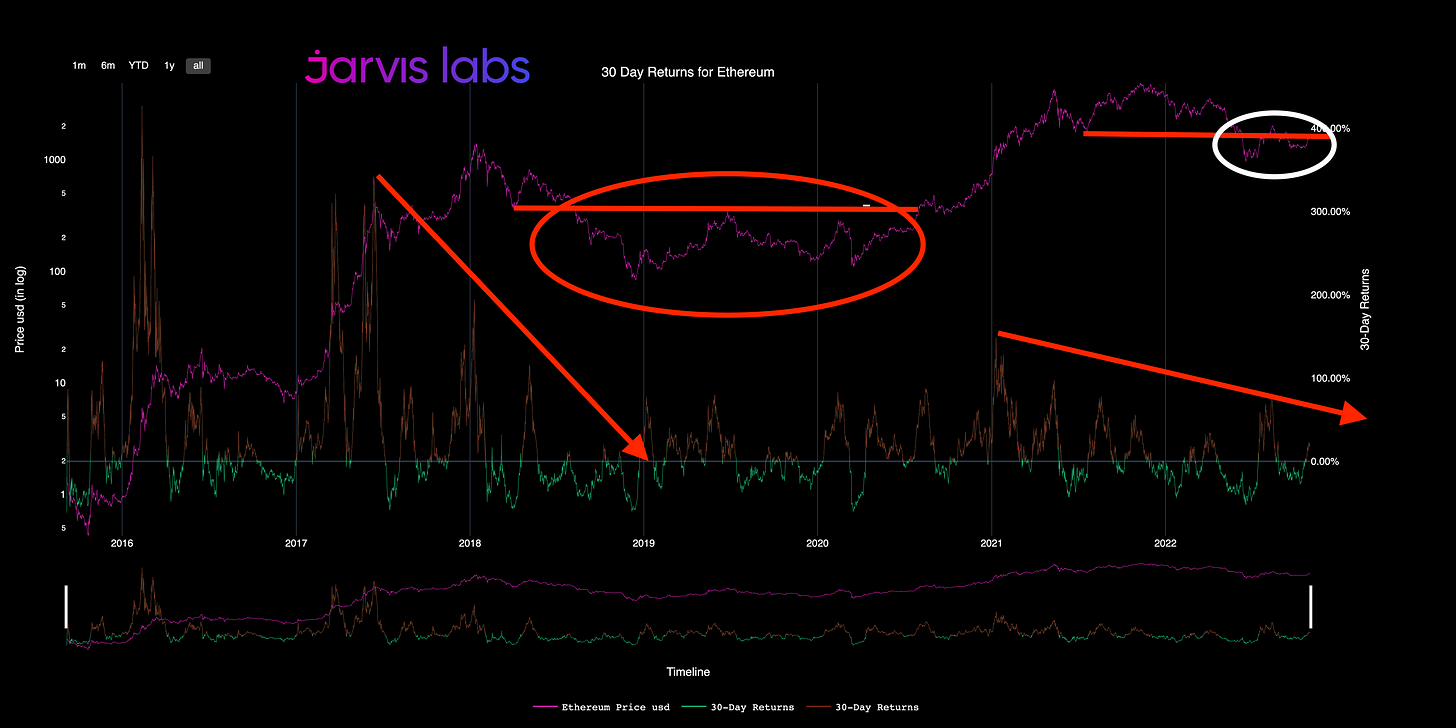
In 2018 there was 30d diminishing return resistance, and a key price resistance level at ~$350. This resistance held firm for 28mos until Q3 '20
In 2022 we again see diminishing 30d returns and a key lost support level ~$1700
In the time since then, ETH’s behavior underneath the $1,700 resistance level is indeed similar to how it performed under the $350 level of 2018-2020, confirming Mr. Benjamin’s thesis.
Back in 2018, Ethereum required consolidation below key resistance for over two-and-a-half years. It wasn’t until the “DeFi summer” of 2020 that ETH finally escaped the bear market’s pit.
But once it did, price flew.
Below, we see how after ETH flipped $350 (red line) from resistance into support, its price went up by over 13x in under a year.
Good times.
Simpler times.
Unfortunately, comparing our current bear market with the fractal of 2018-2020 does not inspire much confidence that a similar resistance break will happen anytime soon.
A look below at an updated version of Mr. Benjamin’s fractal shows why…
We still see diminishing 30-day returns and prices trapped below a critical level.
Worse yet, measuring the length of 2018-2020’s consolidation (red oval) versus 2022’s current consolidation (white oval) makes it appear as if ETH may still need much more time to strengthen.
After all, if a catalyst as fundamentally bullish as The Merge wasn’t strong enough to hold ETH above this $1,700 resistance, what hope does it have now?
The answer to that may be more nuanced than you currently think. Remember, in markets a lot can change in a short amount of time.
Odds of a trend-changing rally into the end of the year do indeed seem bleak, but not impossible.
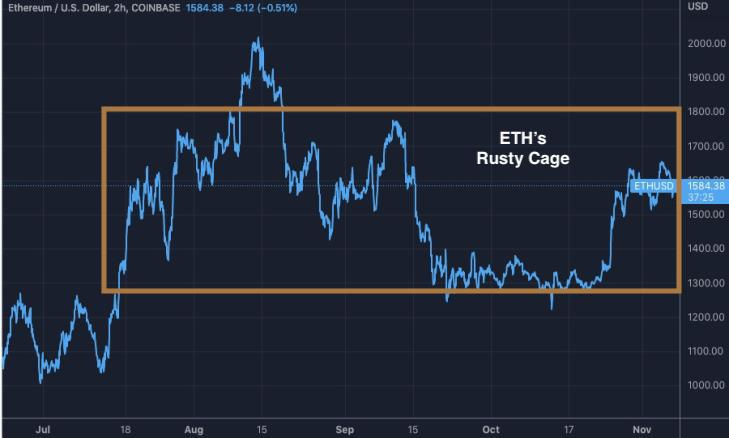
Ethereum’s Rusty Cage
As you likely recall, during the buildup to September’s Merge, ETH did break above the $1,700 to $2,000 resistance level temporarily.
However, this price surge was speculative in nature and failed to last.
Once The Merge catalyst was in the rear-view mirror, ETH dropped by over 30% in just a matter of weeks, as sellers attacked the key resistance level of $1,700 and reclaimed it.
What’s important to note, however, is that after the selling climaxed, ETH buyers stepped in and defended 2018’s all-time high at ~$1,400 with volume.
Below, we see how the largest 24-hour volume recorded by ETH over the past six-plus months came in at this critical $1,400 region, during October’s end-of-month pump.
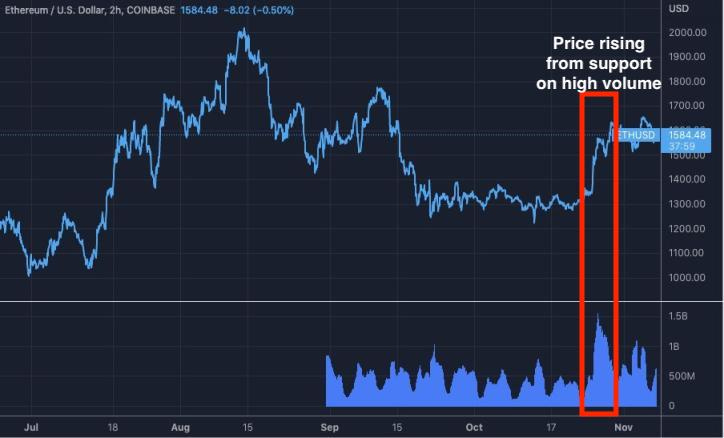
Volume plays a crucial role in determining support and resistance levels.
It allows us to visualize the amount of buying and selling taking place at a given price, and trends tend to follow strong price movements fueled by high volume.
You can think of price action without volume as a house of cards with no foundational support to defend price on retests. By contrast, price action with accompanying volume forms sound market structure.
That makes this recent surge a very encouraging sign that momentum for a resistance break into the end of the year could be building.
As of now, however, ETH is still trapped in a tight range. It’s above the key support level of $1,400, but below the key resistance level of $1,700.
We can think of this range as ETH’s “rusty cage,” as it's the area where almost all of the price action of the past four-plus months has been trapped.
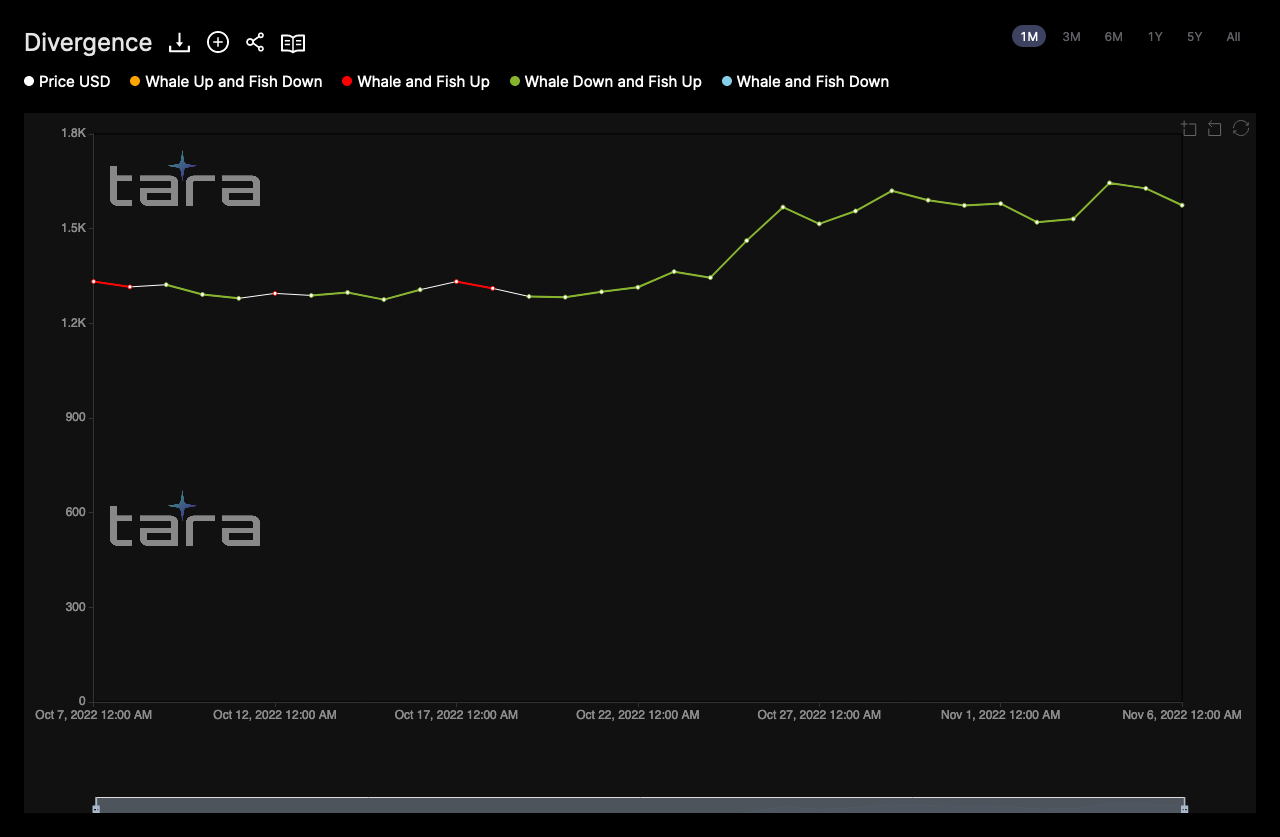
In order for ETH to break its rusty cage and run (RIP Chris Cornell), it will require the aid of large whale buyers who can bring more volume.
Whale buyers who have been notably sidelined as of late.
This chart below from our TARA analytics dashboard shows whale buying divergences.
What the green lines signify are instances of whales selling while retail buys, an ominous combination. Unfortunately, all of the past month has been dominated by this action.
Getting these big players to re-enter at prices high enough to break the $1,700 resistance level for good will likely require a macro catalyst.
With that in mind, there is a specific one to discuss which was pivotal in both ETH’s meteoric 2020-2021 rise and its catastrophic 2022 downfall…
King Dollar
Since the way we price ETH’s value is in dollars, the simplest solution to its price woes is simple yet complex: The dollar needs to lose value.
Macroeconomics is a world of its own, but luckily here at The Lab, we have people like Mr. Lilly, my friend TD, and other analysts working behind the scenes who specialize in analyzing these trends.
One thing they all seem to agree on is this: There is no catalyst more bullish for ETH than a falling dollar.
We see this rings true when we look at how both assets have such a high inverse correlation to each other.
As you may remember, in response to the COVID crash of 2020 The Federal Reserve devalued the dollar and moved interest rates to zero. This laid the foundation for the inflationary issues the global economy is struggling with today.
Once the legacy financial system was no longer capable of paying yields, it created a vacuum, a vacuum which crypto helped fill.
What we saw over 2020-2021 was money migrating out of TradFi and down the risk curve, which led to a tremendous boom for risk assets such as BTC, ETH, NFTs, and high-yield-generating DeFi protocols.
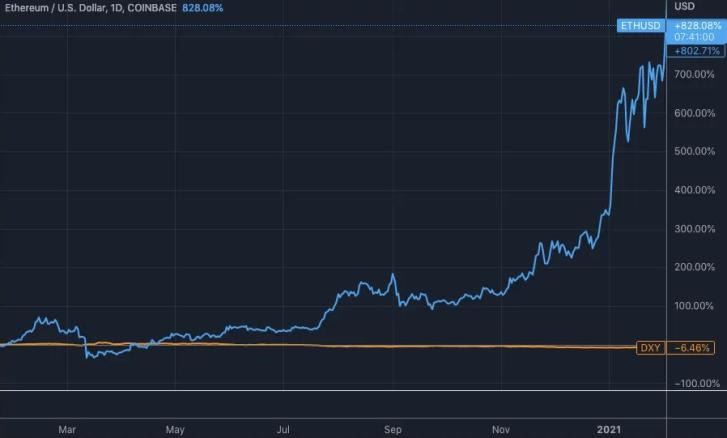
Below we see how drastically this shift played out, as the U.S. Dollar Index (DXY) fell by 6.46% between February 2020 and March 2021, and ETH responded by soaring over 800%.
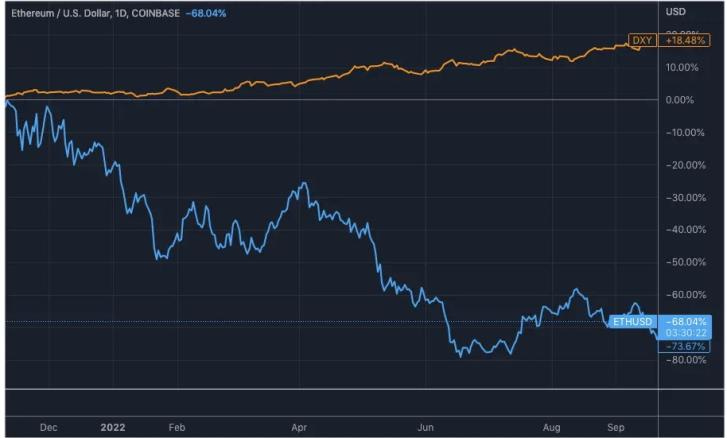
Then after The Fed announced their pivot last November, and signaled they would raise rates throughout 2022, TradFi sucked back nearly all the COVID liquidity it had poured into crypto markets.
When the restrengthened DXY began its 18%-plus rally in late 2021, ETH’s sudden illiqudity led to it shedding 80% of its all-time high value in a matter of months.
Sometimes I think back on how bullish things seemed just this time last November. It sure felt like the dollar would never rise, and crypto would never fall.
Right now, that sentiment is polar opposite. Man, how quickly markets shift.
It’s that simple truth which makes me believe a strong rally into the end of the year is possible.
I’ve been thinking a lot about what I wrote last week and realizing that markets do indeed have seasons.
Right now, it happens to be crypto winter paired with dollar summer, but like all seasons, these assets and our perceptions of them will change again with time.
For reference, here is what the 5-year DXY chart currently looks like:
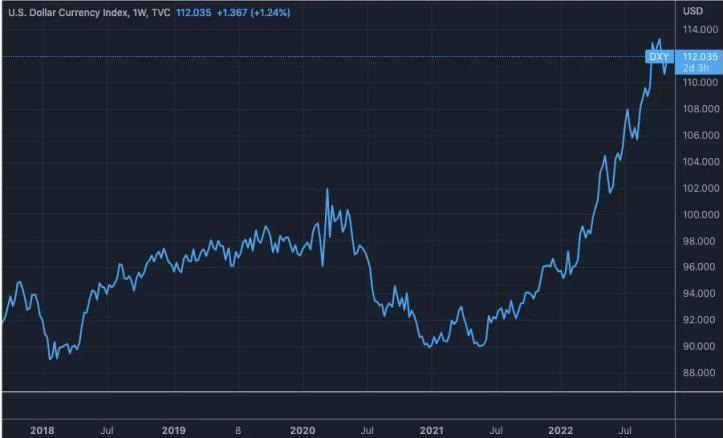
It’s no secret I have an active imagination, but it doesn’t take much effort to envision a scenario where a chart that looks like this reverts to the mean.
A falling DXY paired with ETH reconquering $1,700 to $2,000 into the end of the year could be the type of macro long setup dreams are made of.
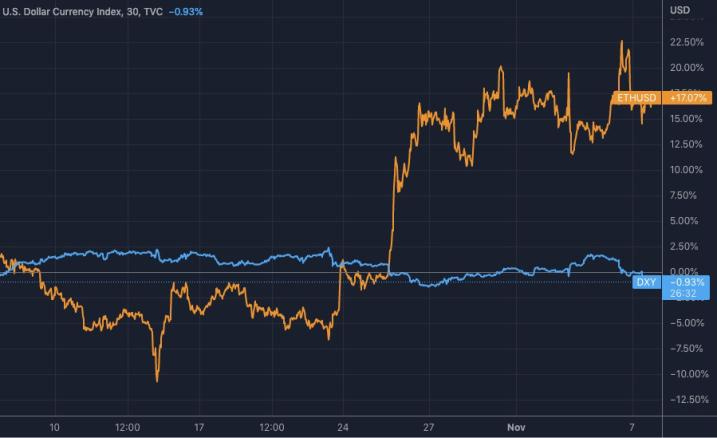
In the past month alone we’ve seen the effect a falling dollar can have on ETH, as just its 1% drop since early October has led to ETH rising by over 17%.
This isn’t to say that the dollar cannot go much higher and ETH much lower into 2023, but to simply point out that sooner or later these market conditions will inevitably shift. It is in their nature to do so.
The best way to be ahead of the trend when they do is to keep a close eye on the correlations, structure, and key levels we discussed today.
What do you guys think?
Leave a comment below or message me on Twitter, I’m @JLabsJanitor
Your friend,
JJ


