Ethereum's Great Depression
ETH's price is getting crushed due to its monetary decisions. Here's how it can repair itself.

Cargo ships are the easiest way to explain ETH's price spiral.
The ships help deliver items across international waters in a matter of days. And what's cool is that you can stack the boxes on these ships like a bunch of legos.

There is only so much space on a ship, and only so much weight that the ship can hold. Which means both space and weight are natural constraints for each block... I mean ship.
And there are only so many ships available on any given day.
This creates a market price for the available capacity on a given ship. It's in part why COVID caused such massive supply chain issues. Free money got rained down on a population sitting at home armed with Amazon at their fingertips.
The uptick in online shopping caused prices to rocket and cause many economists to point to this market as being responsible for about 30% of inflation. The money printer was also getting some justified blame.
Now, with shipping, you can't just create a new supply in ships overnight. It takes too long to find the builders, the materials, and then actually build the giant flotation device.
If we could, then the uptick in more ships would have helped alleviate a lot of these pricing pressures. And if we could... Well, what do you think would be happening today?
Shipping costs would likely be a lot less due to the added ships available. Businesses that built up fresh supply might now be underwater on their finances... Pun fully intended there... Because their incoming revenue will not justify the gas, docking fees, repairs, etc.
This sort of knee jerk reaction of doubling the supply of cargo ships would undoubtedly lead to current outcomes of: lower prices, lower production, lower wages, lower demand... Which then would create even lower prices, production, wages in the shipping industry.
In some ways, the magic hand of the market works itself through such times.
But for some reason, this exact practice of doubling cargo ships happens all the time for Network Economies.
To prove it, let's check out Ethereum and showcase why this sort of knee jerk reaction has led to a Great Deflationary Spiral... I'll then go into what will need to happen for it to claw its way out of such a mess.
The Spiral Started Before March 2024
This story begins back in August 2021.
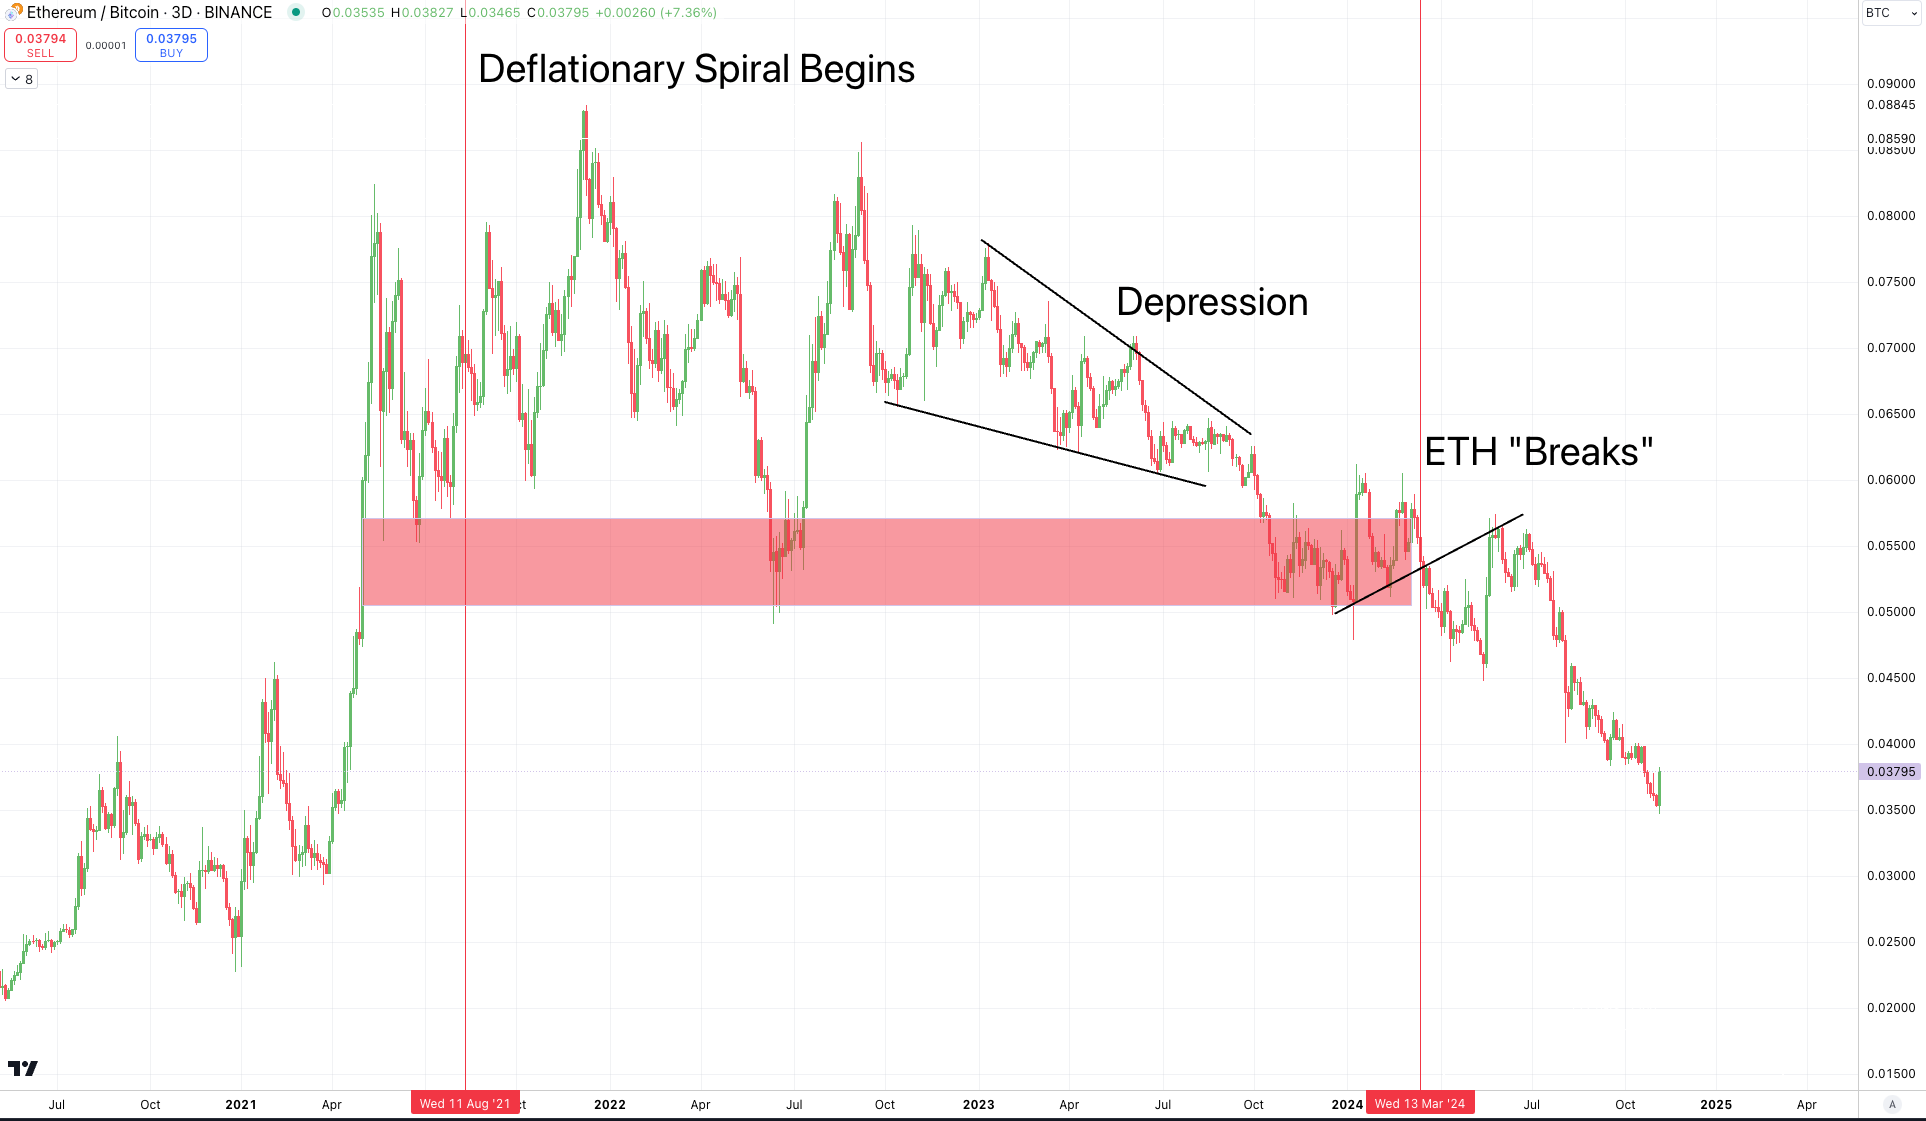
I know... I wrote March 2024 just two lines earlier. But to understand the significance of the terrible shape that ETH is in right now, we need to pull up a chart of ETH/BTC.
The reason being is that in March of this year, Ethereum went ahead and doubled down on its deflationary trend. And it caused the ETH chart to quite literally breakdown.
Structurally speaking, during the start of 2024 ETH as it looks relative to Bitcoin was trending out of a local bottom with higher lows. It was showing some strength... Until the second vertical red line. (Ignore the left hand side of this chart for a moment. )

This second vertical red line marked the day Ethereum conducted its Dencun upgrade. It was a day where Ethereum decided to reprice a segment of its fee market.
Such a decision resulted in Ethereum no longer realizing 8k worth of ETH each day in demand. And at its peak just a week before the upgrade, it was commanding 10k ETH.

That's organic demand for the most fundamental reason for owning ETH - to change the state of the network and form consensus around it... AKA a transaction.
Shortly after this upgrade, demand trended lower to below 2k and later, 1k of ETH each day. Again, demand related to Ethereum's most basic use case.
Now, I'm not here to argue whether it (blob markets) was right or wrong. If anything, I argue it could have been done better. In fact, I'm in agreement it was needed, but not in this manner.
To know why, we need to go back to where things started to go wrong - August 2021.
That's when certain actions kicked off the Deflationary Spiral.
More Ships
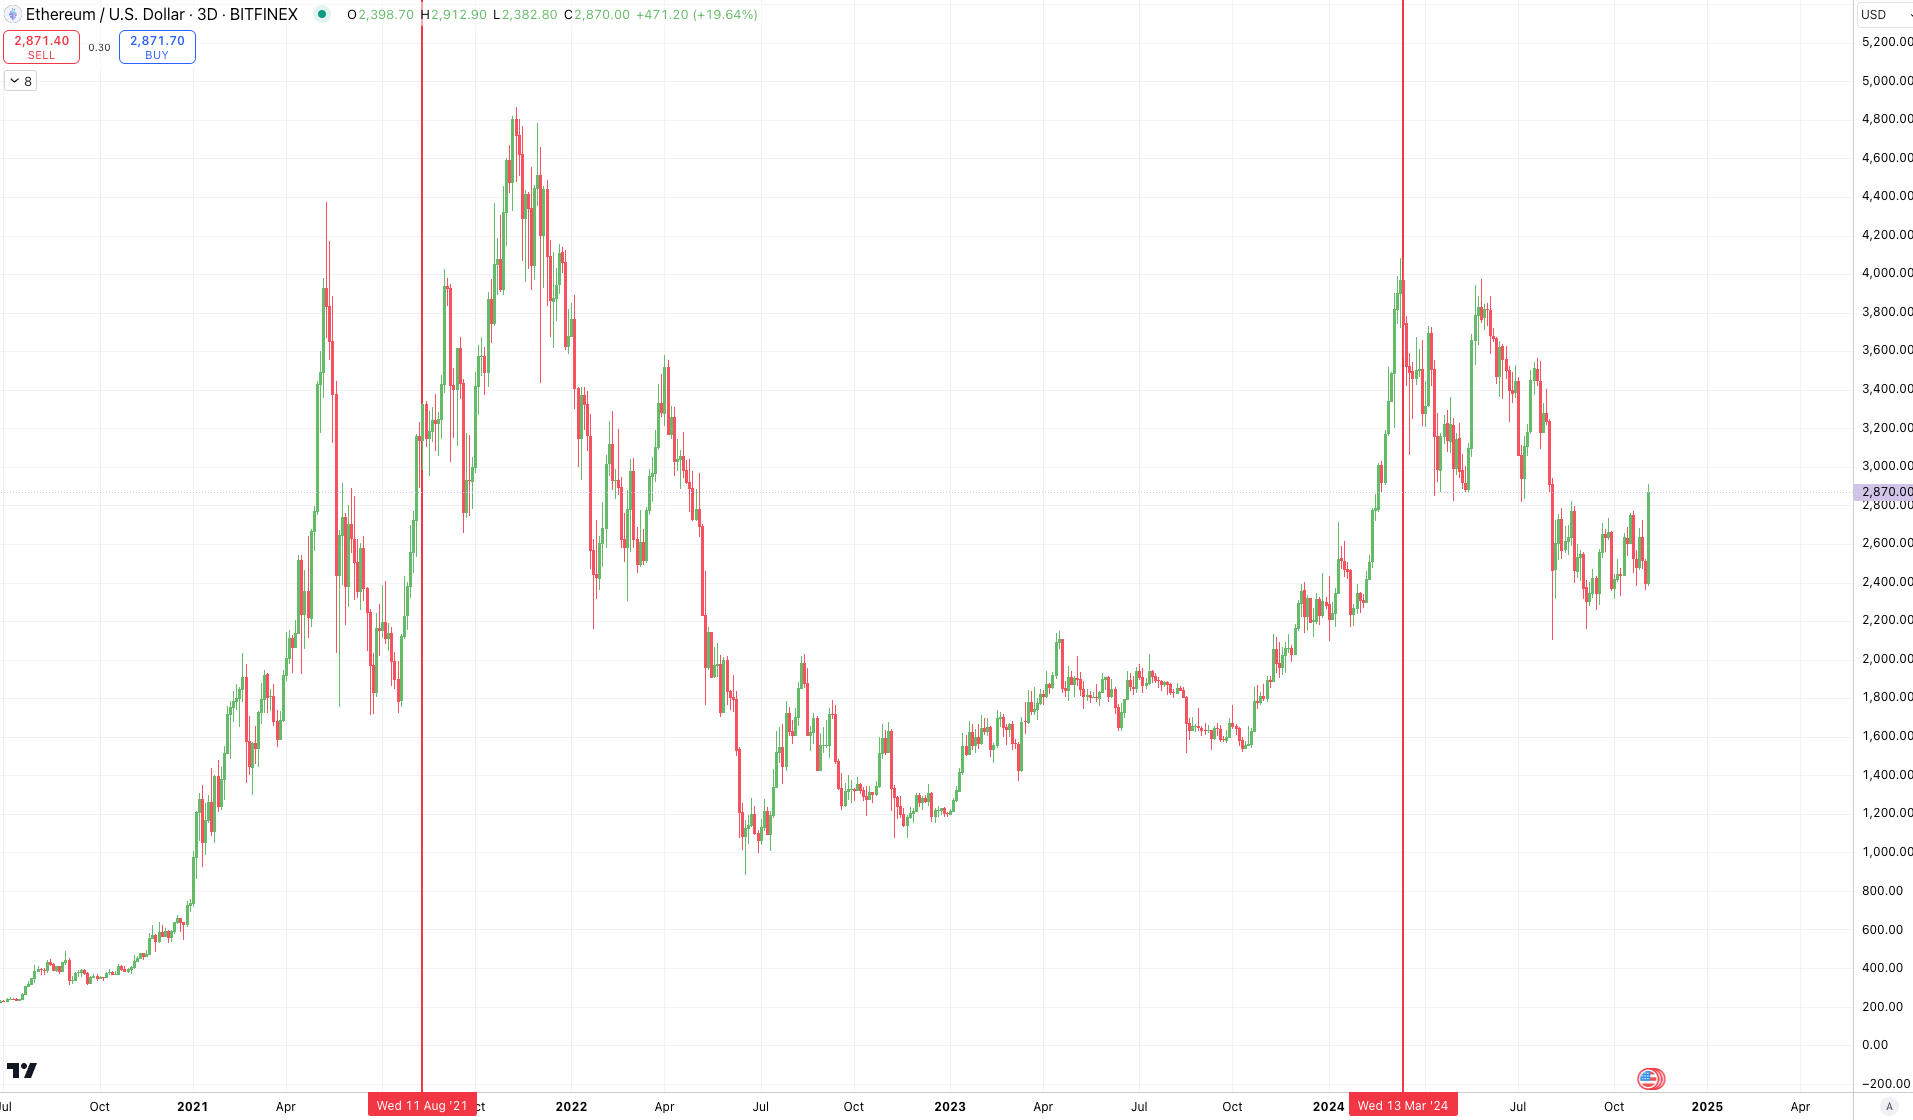
Time to look at that first vertical line in the chart earlier. To help, I dropped an ETH/USD chart below with the same vertical red lines.

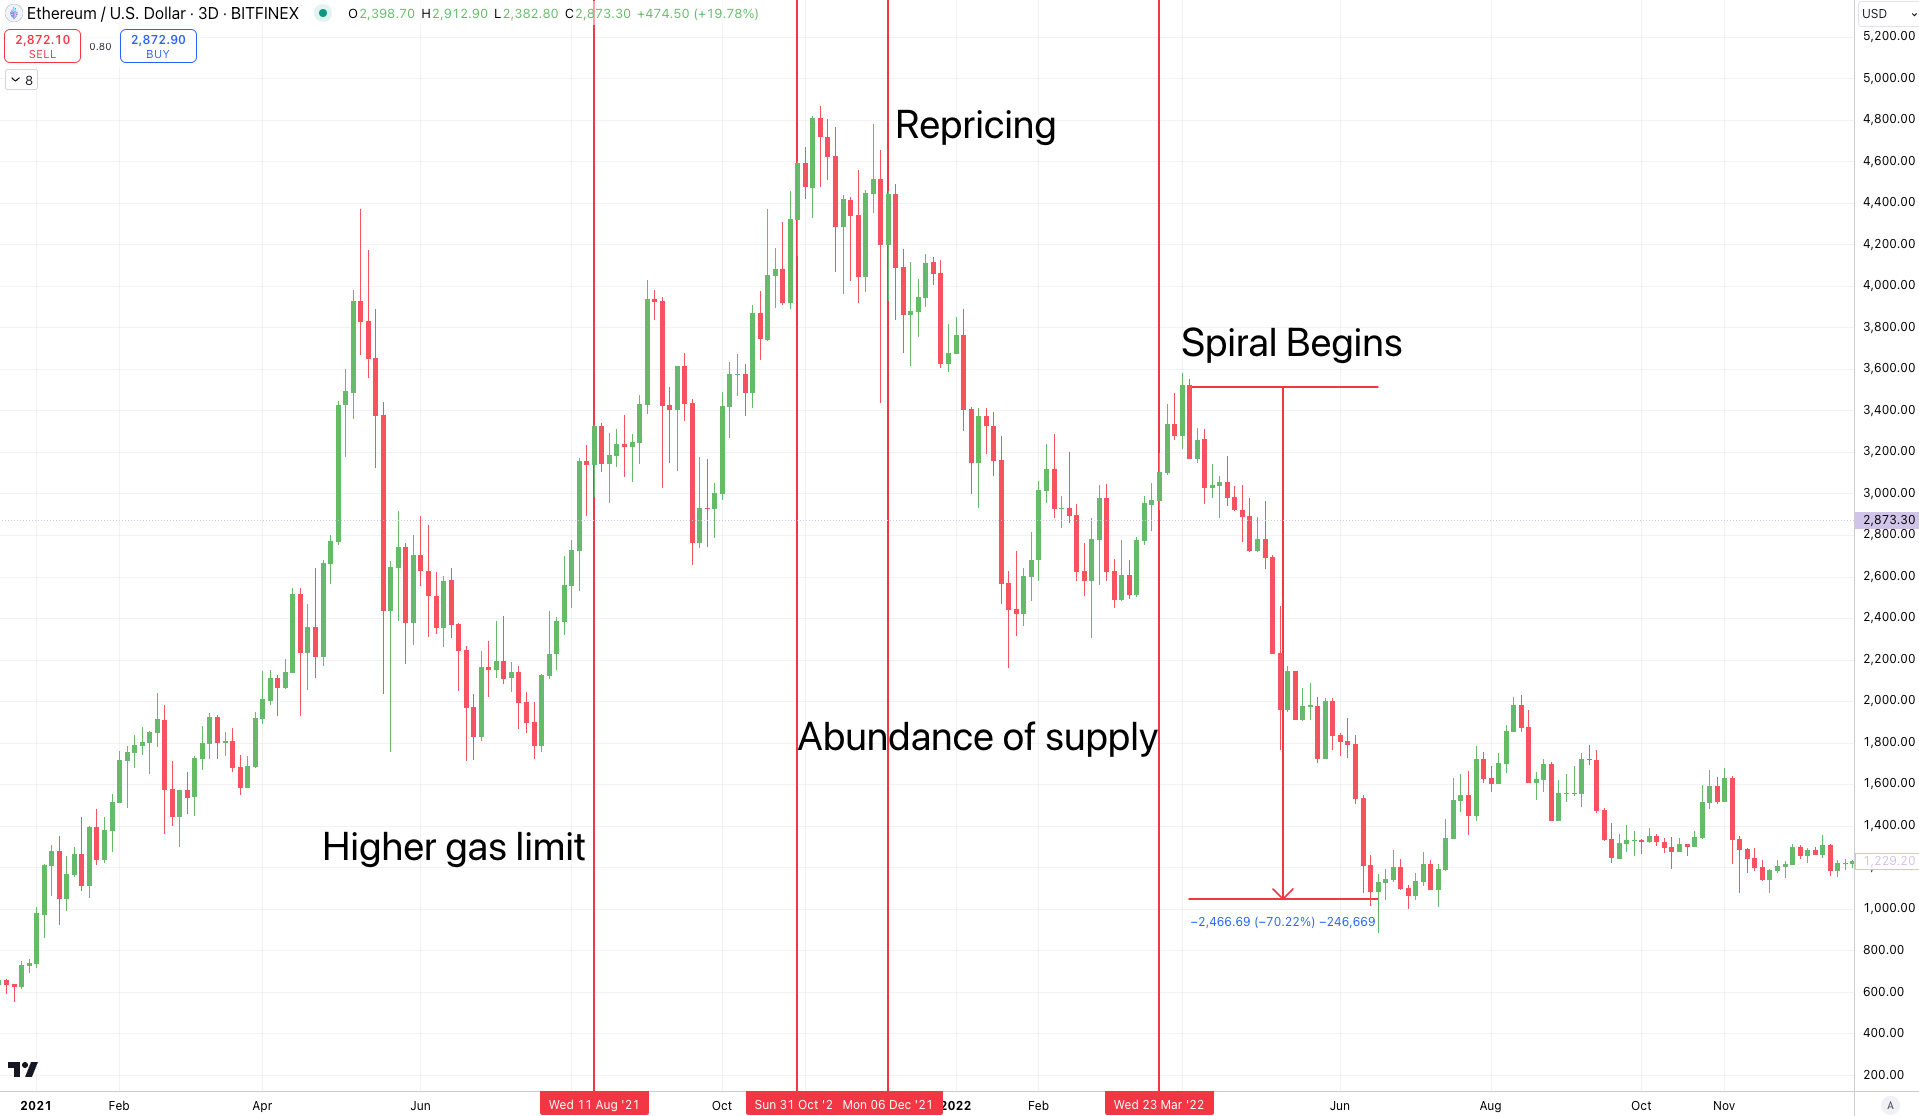
Now, the red line at the left is when Ethereum increased its gas limit.
This changed the amount of available gas that the market could use in each block. Meaning a DEX swap of 100k gas took up a smaller share of the total amount of gas available in the block.
To use our ship analogy... We saw a lot more ships appear overnight.
Whether it was needed or not, that's not the main point. Regardless, it happened. And all of a sudden, block space in the form of gas was more plentiful.
You can see it in this chart below.

Now, it's important to note that the market didn't respond immediately to this uptick in available gas. Meaning the price per unit of gas remained elevated.
That's mostly because 1) the market was hot and 2) price levels like this take a bit of time to come out of the market -> think Jerome Powell when he spoke about people's price expectations in a global market, that it takes time to reverse (aka sticky inflation).
Soon after this uptick in gas limit took place, we can see that the block size rose initially as the demand that was priced out of the market was able to get soaked up.
But by the end of October, it seemed that this glut of available supply started to no longer be needed.
It was time to decommission some of those cargo ships to avoid the deflationary spiral.

Here we can see when the market signaled there was an abundance of supply on the Ethereum network... And shortly after this moment, the all-time high was forged into the chart.

The market started to respond to the overabundance of gas available in the market.
And this began the deflationary spiral. Again, deflation is when the cost of everyday items gets reduced. It's typically subtle and can be for various factors such as technological advancements - uptick in throughput in this case.
In Ethereum's case, the overabundance of supply was a major deflationary moment. And when we look to see when the market started to reprice this supply...

It was in December. That was our second warning sign. Remember, price changes take time to ripple through. In crypto, things happen on an accelerated timeline... And by February 2022, this trend was well entrenched...

But again, the supply of block space didn't adjust. The result was the deflationary spiral got ugly...

Shortly after, the market corrected 70% on ETH.
Yes, there were a lot of factors at play here, but it's important to understand that the amount of cargo ships available to move transactions were excessive.
There was no drop in available block supply. And so the demand for ETH to pay for compute dropped hard as well.
What's also important to note is that the burn mechanism for Ethereum increases volatility, and also increases the severity of such spirals.
As gas fees start to rise in the market, ETH supply contracts. Meaning ETH becomes scarcer. This causes heightened price volatility to the upside.
Then as fees decline, ETH supply increases - less burn. It's likely "suppose to" act as fiscal stimulus, but that stimulus doesn't go to holders to incentivize usage. Keep that in mind. It is not a fiscal stimulus to spark network activity.
Instead, it dilutes holders just as things get cheaper. That will only hurt an economy's price level even further... That would be like massive negative inflation rates AND the money supply rising.
Have we ever seen that?
Not even during the U.S. Great Depression in the 1930s, a time period where inflation was very negative. To run an analogy similar to what Ethereum experienced... Imagine if money supply grew during the Great Depression, and that money didn't go to the consumer? I shutter...
Getting back to the point of this...
The price move in 2022 was likely exaggerated due to these fundamentals. We can even look at these moments on an ETH/BTC chart to see that these fundamental factors absolutely played out. Its movement compared to BTC was excessive.

Abundance of supply created a market repricing, which then translated to lower demand for the native asset to pay for that supply... All why supply rose.
Ultra sound money was ignoring monetary theory all together.
But let's not stop there. Let's pile on these sinking fundamentals more by checking out the recent "break" of ETH.
Killer Blobs
In March 2024, the Dencun upgrade brought the blob market to light.
This was a way for L2s to post temporary data to Ethereum in a cheap manner. The market itself is dynamically priced such that when more L2s post data, prices rise... As long as the number is more than three blobs in a block.
If below three, the price falls. At three, pricing stays the same.
Fees immediately dropped in the wake of this upgrade... Gotta keep the cargo ship theme going here.
We can think of this as certain types of cargo now getting super cheap transportation costs on the existing overabundance of cargo ships in the market.
To illustrate how much this market changed things, let's pull up the chart from earlier. This shows the amount of transaction fees in ETH happening on Ethereum. From March's high of 10k, it took only weeks to get below 2k. Dramatic repricing.

And to pull up our price charts with that second red vertical line...

And then in USD...

The second red line is again, the Dencun upgrade. ETH quite literally looked as if it broke after the upgrade.
What's important here is Ethereum was recovering from the changes made from 2021. And as it started to gain momentum, Ethereum developers made the same mistake.
It piled on to its deflationary spiral just as production on the network was rising again.
But unlike the cargo ship business, there is minimal cost to operate the block space. If there were, then the overabundance of supply would pause operations like a cargo shipping business.
There is invisible hand. Gas limits are arbitrarily set, and the blob market is arbitrary set.
In fact, I would not be surprised if Ethereum decides to alter the blob market just as L2s start to drive some semblance of demand for block space.
Assuming they won't shoot themselves in the foot again... Mostly because people only have two feet... But in case there is the off chance that they might...
What should we be watching for to see if ETH can pull itself out of its Great Depression?
We need to watch two things. The first is the blob market. We want to see continual usage of more than 3 blobs per block persist. Its been climbing over the last two weeks, but as of today, it's starting to taper again.
We can see this with Hildobby's excellent Dune dashboard here...

And here... Note: The one on the left is a five day look back while the one on the right is the average blobs/block since Dencun.

Now, the key here is the blob count per block needs to be above three for an extended period of time before it starts to translate to substantial demand for ETH. To see this, we can view the chart below, again, from the Dune wizard himself Hildobby.
The chart on the left is the last five days... Note the drop off over the last 36 hours. The chart on the right is since Dencun... Note how little the recent uptick is of late, meaning this is simply not enough to move the needle - sorry ETH gang, but there needs to be more here.

So what does this really mean here?
Well, first of all... Ethereum has a history of terrible monetary policy when it comes to its token. Its actions to date have helped usher in a deflationary spiral to the network. And we should not be surprised if they decide to push through similar tweaks in future upgrades as more L2s come online.
Meaning each upgrade we need to weigh what the monetary impacts to the network will be.
Second... Well, let me hop on my soapbox... Or cargo box?
Vitalik
Make Ethereum Cypherpunk Again...
This was Buterin's call to action to the community. I think it's great. In fact, I recently wrote how Ethereum is likely to act as the rails for Globalization 2.0 in Imagine: Globalization 2.0 And The Future Of Money.
But why would any business owner or app developer build a product when the economy does not strive for greater price stability?
Central banks pursue price stability and maximum employment (users) to maximize production... For a reason.
If we were to look at the business owner in Argentina that weathered historic levels of inflation... We see that much of their time was spent watching price markets and finding new markets to arbitrage their currency. Not perfecting their craft or investing in themselves.
In an environment where price instability is the norm, its hard to forecast expected revenue or expenses. Ethereum itself looks to have app developers sponsor gas fees for theirs users in the hopes that this would be a major improvement to usher in a better user experience.
As a business owner, why would you do such a thing when it's nearly impossible to accurately predict expenses?
This is why the market focuses on speculative apps and use cases. It's building with the user in mind.
And unfortunately, as ETH's price eventually catches a bid as the tide lifts all boats soon...
The Ethereum burn will turn into an inferno. Supply will contract just as each unit of ETH doesn't go as far as before. And I'm guessing more blockspace will show up that will kickstart the next deflationary spiral.
This is in part why the team at Jlabs Digital went ahead and created a CPI index, to see if this viewpoint was in fact accurate. It is.
We can apply macroeconomic indicators to things like the Ethereum network. And in doing so, perhaps the fee market can introduce price stability in order to maximize users.
I'll drop our v1 CPI index in the P.S. at the bottom here as we prepare to release a v2 in the coming weeks.
In the meantime, please share this post with your friends and chat groups. We should all be aware of how such actions by a developer team might be detrimental to the long term goals of a network.
Additionally, let's continue to see if Ethereum can realize higher fees before we get too excited that price is about to hit the levels I posted on my X timeline earlier today.
Your Wake on Crypto,
Ben Lilly
P.S. - Here is CPI w/o taking into account the price of each unit of gas. Note in 2020 how it jumps as a result of the network asking to use more gas per transaction during DeFi Summer. That's the first red box.
Essentially the average basket of transactions in terms of gas being used rose. Users were asking to consume more gas on the network than before.
And in August 2021, the second red box, the market's preferences didn't change as block space rose. If block space responded to upticks in consumer preferences, it would be more dynamic and more likely to avoid such deflationary spirals.

If we layer in the cost of each unit of gas, we can see how volatile this economy really is.
The first box is DeFi Summer. If we were to YoY this figure, it's in the thousands of percent. That's orders of magnitude worse than what Argentina experienced.

Then the second red box is when block space opened up. Inflation was coming down... And the glut of supply caused a massive deflationary spiral.
As we update this into a v2, we will be better able to see how the recent blob market created something similar to what we see here.
Now, if anybody has a contact at the Ethereum Foundation, please share this. I'd love to work with them in securing a grant to standardize this type of metric to aid in policy development. We have a handful of ideas that might prove helpful in making Ethereum sound money.


