Drift Analysis
Here's where we are going as the market drifts, rudderless. Plus, why Bitcoin is an inferior currency.


Being rudderless just North of Havana, Cuba...
It wouldn't be so bad.
The waters are warm, fish tend to populate the area, and you sort of know where you'll end up.
There's also a constant flow to the ocean courtesy of the Gulfstream current.
The Gulfstream flows into the Caribbean and Gulf of Mexico from the area of the Atlantic Ocean near the Equator. It then exits those bodies back into the Atlantic Ocean near Florida, USA and the Bahamas.
This clockwise like movement starting from the Equator means the water is generally warmer. Nutrients tend to flow on that converyor belt and is in part why many fish tend to travel the current as well.
This is all to say, if you found yourself rudderless North of Havana, that's the current you care about.
That doesn't mean storms or other smaller currents won't influence where you go in the near term. You might find yourself closer to Cuba or the United States depending on how things are moving about from week to week.
But generally speaking, you're headed East to the Atlantic Ocean .
And as I stared out at the waters this previous weekend, I can't help but think crypto is rudderless. Directionless.
Anything that claims to be a defining metric or data point is simply near term data points amidst a larger current.
One that we need to rely upon as we seek conviction in what feels like a rudderless market.
Here's what I mean...
Analyze The Rainbow
I'm coming up on 40 years of crypto experience.
That's assuming each bear market adds ten years of age to the mind of a normal analyst.
Dog years for crypto.
The multi-decade worth of experience I've since amassed means I've seen various metrics, technicals, and ways to interpret the market gain and lose popularity.
Of the more popular ones, the cycle oriented "stuff" always is most popular. The reason is pretty simple...
During a bear market, these metrics clearly show things are underpriced. When newcomers enter the crypto world, they are greeted with dozens and dozens of analysts and "gurus".
The easiest thing to digest tends to be the thinking around halving and cycles. It's pretty straight forward. New emissions get cut in half, supply is limited, four years, market goes up, yadda yadda yadda.
For this reason, onchain cycle metrics do well. If you're unsure what these are, just head over to Bitcoin Magazine's onchain dashboard. It's good and free.
I'll give you a quick glimpse of a personal favorite of mine... HODL Waves.
The metric breaks down UTXOs, which is a fancy way of saying if you spend $20 for a $5 item at the grocery store, the cashier will hand you $15 worth of UTXOs. And since it's onchain, I can see the last time that those $15 moved.
HODL Waves breaks down these UTXOs in terms of time. Which means we can look at cohorts of hodlers to see how strong those diamond hands are at any given time.
The truth on why this analysis works is for behavioral reasons... Bitcoins tends to move hands as distribution takes place. Once a healthy amount of distribution takes place, accumulation needs to take place again for a rally to materialize.
An asset generally needs somebody to confidently put their money where their mouth is. HODL Waves does that.
In knowing this bit of background, this analysis helps to solidify whether we are in a bear market or a raging bull market. Let me show you what I mean, below I pulled up the chart and zero'd in on UTXOs that haven't moved in six months to three years.
What we see is that we are nearly at the same level of "HODLing" as the first price peak in 2021.
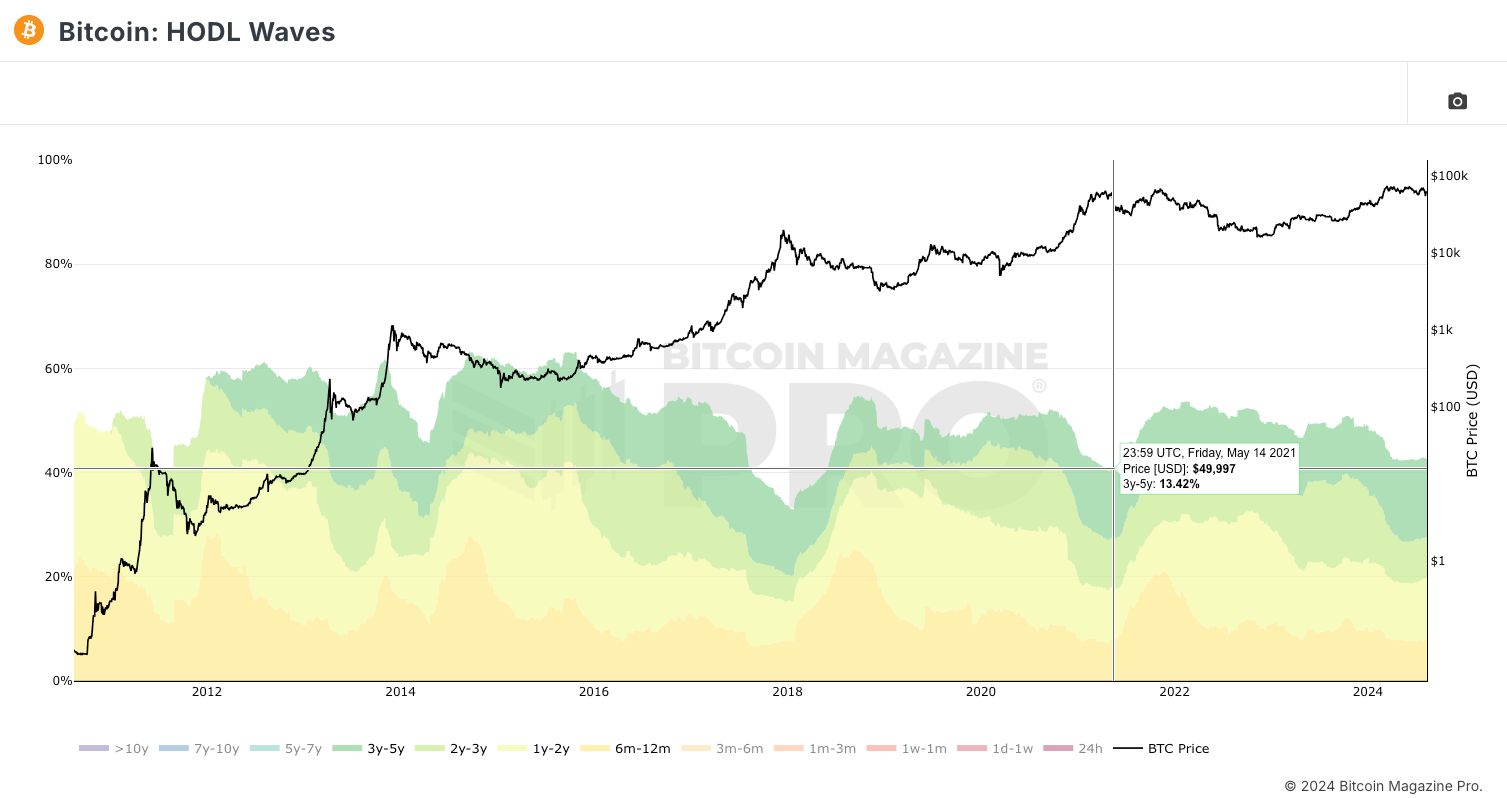
That's not comforting. The next high was barely much higher.
Sure, the HODL wave is a little higher than what we saw in 2021, but also, the 2021 low was higher than what we saw in 2017/18. Meaning these trough are not something to place a bet on.
And this right here speaks to the difficulty of most onchain metrics that are more than four years old. In a bull market, they signal we are in a bull market. In a bear market, we can easily see we are in a bear market.
What's more is some of the most popular tools like stock-to-flow and the "joke" Rainbow chart act with similar helpfulness.
Essentially, they all tell us that in due time, price will go higher.
It's the warm and fuzzy insight that anybody seeking market analysis in their early years will happily digest as it confirms their newly acquired bag biases.
But here's a stark reality...
Those models get tweaked to the downside each cycle. Note here how PlanB's stock to flow model is missing upside targets more and more. I added my very scientific black lines to the dots in order to help showcase it.
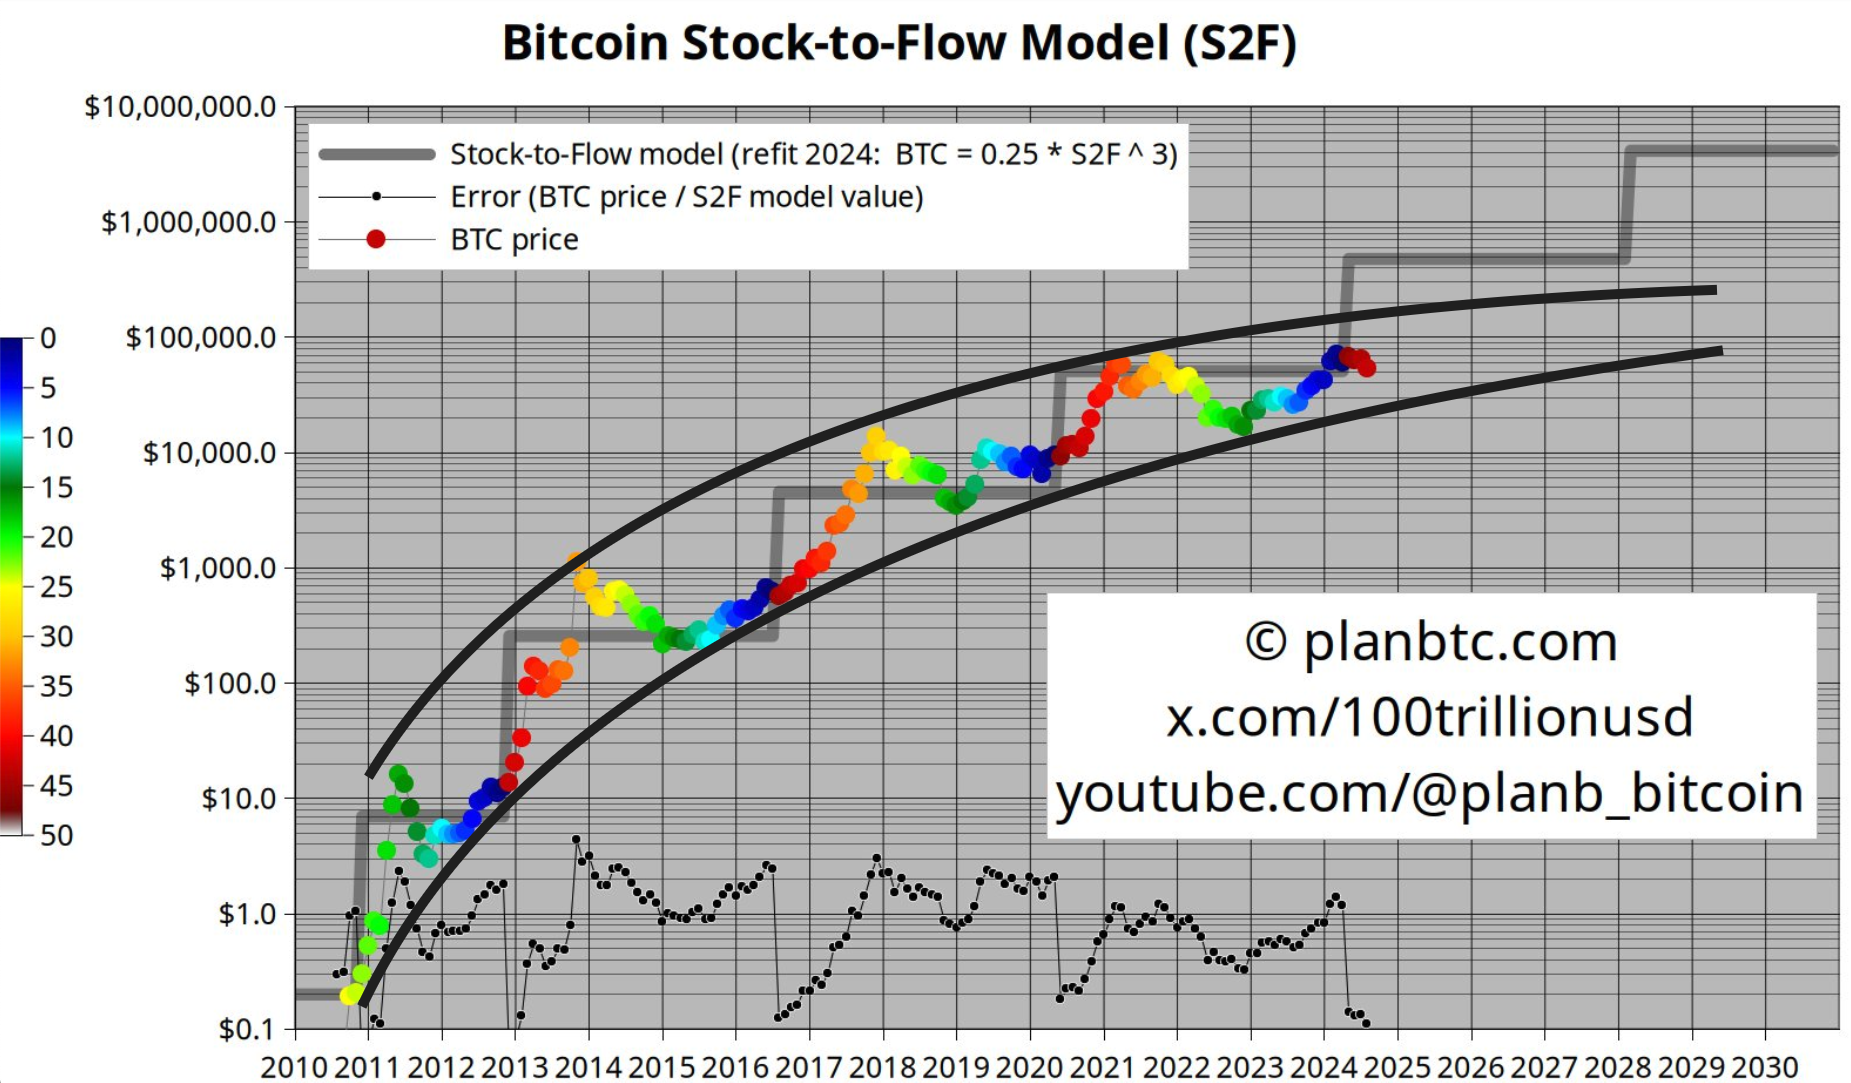
I added those black lines to help me bridge over to the Rainbow chart. The Rainbow chart is sort of now a humorous gag on why there's no need to over complicate cycle analysis (ie - no need to spend time on HODL Waves).
Even this chart shows a similar trend of lower highs than what was the expectation. I'm sure I could spent an hour talking about Power Law to serve as justification, but I'll be honest, the Rainbow chart sums it up. No need to mid-curve it with various academic papers on the subject.
You can even read a post from a guy who claims to have the most recent rainbow model... idk, I think Eric Wall has disagreed with him quite a bit, but I really don't care that much. Anyways, this post shows the history of re-fitting the Rainbow each cycle.
Anyways, here's the rainbow chart on my TradingView... Point being, look at the black lines. The Rainbow needs more arc.
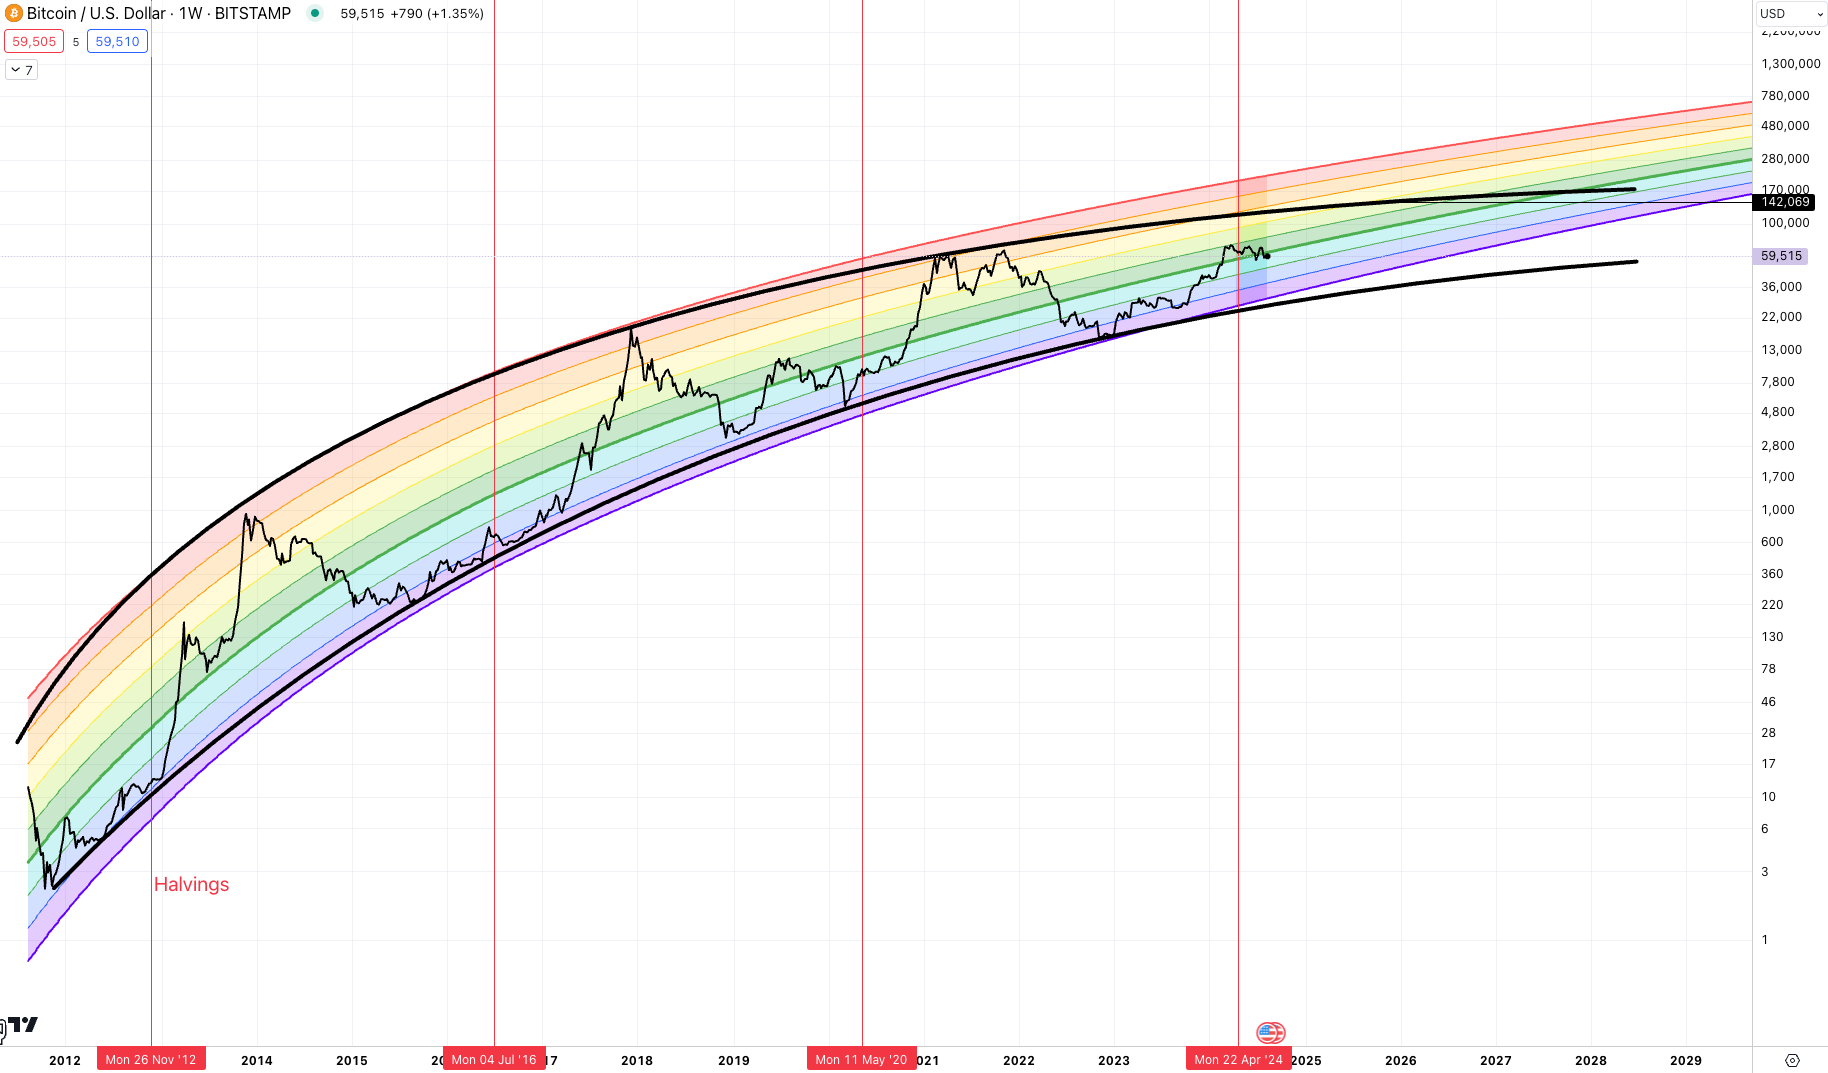
So here we are, about 1,000 words into Espresso and all I've really said was that cycle analysis is showing cracks. It's being re-fitted down each and every cycle... Meaning the trend of this break down is underperformance of what the market thinks.
Sure, the supercycle theory of mass global adoption could blow this out of the water, but that's a speculative bet, one I don't believe in.
Here's why.
Bitcoin Is Inferior
I probably should have put a trigger warning there.
But before I lose you, let me at least explain... And no, I'm not getting ready to say U.S. Dollars or Ethereum is superior. I have a bone to pick with Ethereum which I hope to get to at a later date.
I want us to consider for a moment the early days of America. I know, most of readers here are not from the burning empire of the world, but bear with me because it has a rich history of creating money.
In the early days of the new republic, new currencies and banking systems were being created constantly.
In fact, things were so wild that at one point a guy named Robert Morris had a bank that was insolvent, embezzled money that was lent to the United States from France to his own bank... Then doled out war contracts to his buddies that he then financed through this newly acquired government money. This was one of the earliest central banks back in the 1780s. It almost has some ties in with FTX...
The reason this madness was possible is that each state even had attempts of creating money. The result of them was failure. The urge to print is too great.
The need for a central authority allowed Mr. Morris to gain a foothold.
Nonetheless, all of these failed experiments kept revealing the forces of Gresham Law... Which is good money tends to leave circulation and all that is left is inferior currency.
Basically, people HODL superior currencies. This causes them to disappear from circulation.
I know what you're thinking... The use of "HODL" there is a hook to bring it back to Bitcoin...
Well, you're right.
When it comes to Bitcoin, can we apply this same logic to the network. But not from those that simply just hold the currency. Instead, let's look at the miners...
These miners mint the currency.
Think of that for a moment. The entities that are responsible for putting blocks together that store transactions in what looks like a transparent cubes in our imaginations, is earning the newly minted Bitcoin. Their actions create new coinage.
Yet, they turn around and sell it on the market.
Miners are using energy to mine a commodity that they then turn around and sell to the market.
Now, if there were a Bitcoin economy in which these miners would opt to hold Bitcoin outside of speculative reasons, then this extraction wouldn't be so significant.
This "economy" part is why I view Bitcoin's push for additional functionality to its network so crucial right now. Otherwise, what we will witness is this net extraction from miners is a drain on the currency. They are "leaving" to the market what they view is inferior.
And that's what I believe is playing out in the cycle charts above. This choice of selling BTC for something else is causing these models to be revised downward.
Bitcoin will go up from here with >97% confidence based upon Power Law... At least that's what some Harvard PhD guy said in a short clip I saw. I didn't watch the entire podcast, so my number is likely off... with 97% confidence.
Regardless, I buy into the cycle view that prices will return higher. This is the Gulfstream oceanic current we are all subject to regardless of the week to week fluctuations.
But what's also likely is these models will get revised downwards as we huddle around the internet for warmth three years from now in 2027's Crypto Winter.
Is there a saving grace? Yes.
Right now, the Bitcoin network / economy does not attract these miners to become native financiers. There is a lack of native credit creation with Bitcoin. You create credit, you create growth. And that's the linchpin of a growing economy.
Fiat currencies had their issues. Commodity money before that had its issues. But banking solutions surfaced to hep economies function better.
No reason this can't happen with Bitcoin in time.
For now, miners act to earn Bitcoin to make profit. It's not based around the thinking to store capital that then goes towards the creation of more Bitcoin - a productive economy... their action is merely an arbitrage between the cost to compute blocks, energy, and the market price of bitcoin.
And since this selling of Bitcoin is to secure either profits in the economy in which the miner resides/domiciled in or to improve their efficiency in computation or energy costs... The truth here is that the superior currency for miners is not Bitcoin. It's merely a commodity to arbitrage with layers of speculation that are on a long enough time horizon to be thought of as a store of value.
This is why I see these models getting tweaked lower each cycle. This arbitrage layered in speculation (the speculative part here is an entity thinking that it's OK to absorb a loss on the balance sheet because BTC will be higher tomorrow) is playing out cycle after cycle...
And the hard part of this reality is that speculation in crypto is a substitute.
As more currencies prove themselves to have staying power, the options expand for somebody looking to successfully "store value" in a digital asset.
So as the speculative allure erodes away, the question remains... Is Bitcoin's speculative force great enough to outweigh the extraction happening through arbitrage.
Seems rather gloomy, eh?
But don't lose hope... I really do think these networks can create new economies. Bitcoin is getting very close. We can see new projects coming each month trying new ideas.
If one of these ideas can unlock this layer of usability for Bitcoin in a native sense, it would be a massive win and make Bitcoin a universal asset.
For now, we rely upon our oceanic cycle current to drift us higher.
As for the rudderless part of this essay...
Finding Out There's No Rudder
For those who read last Friday's Espresso called Risky Weekend you'll recall a discussion on bid-to-ask ratio. It proved helpful given how the books were stacked going into the weekend.
This caused me to spend the weekend looking at some other metrics... The truth is I couldn't find crap.
Now, I should apologize for my language there, I typically don't sputter four letter words in the pages of Espresso... mostly because I was taught if you use a four letter word, it just means you can't come up with the correct word... aka "highlight the word, right-click, select Synonyms" and find a word that better describes what you are trying to say. The four letter word is a cop out.
But this time around, I literally couldn't find the matter that gets flushed out after a day's meal.
That's in part why I wrote about cycle analysis as I needed something to find solace in.
But here's some additional explanation as to why I couldn't find much.
First off, J-AI went short into the weekend. Its since taken a few positions as orderflow changes, but nothing to brag home about as results are flat for the week.
If we take a look at the order books, we can see a similar story play out. On the spot side (Left-hand side below) the asks are outweighing the bids at all levels.
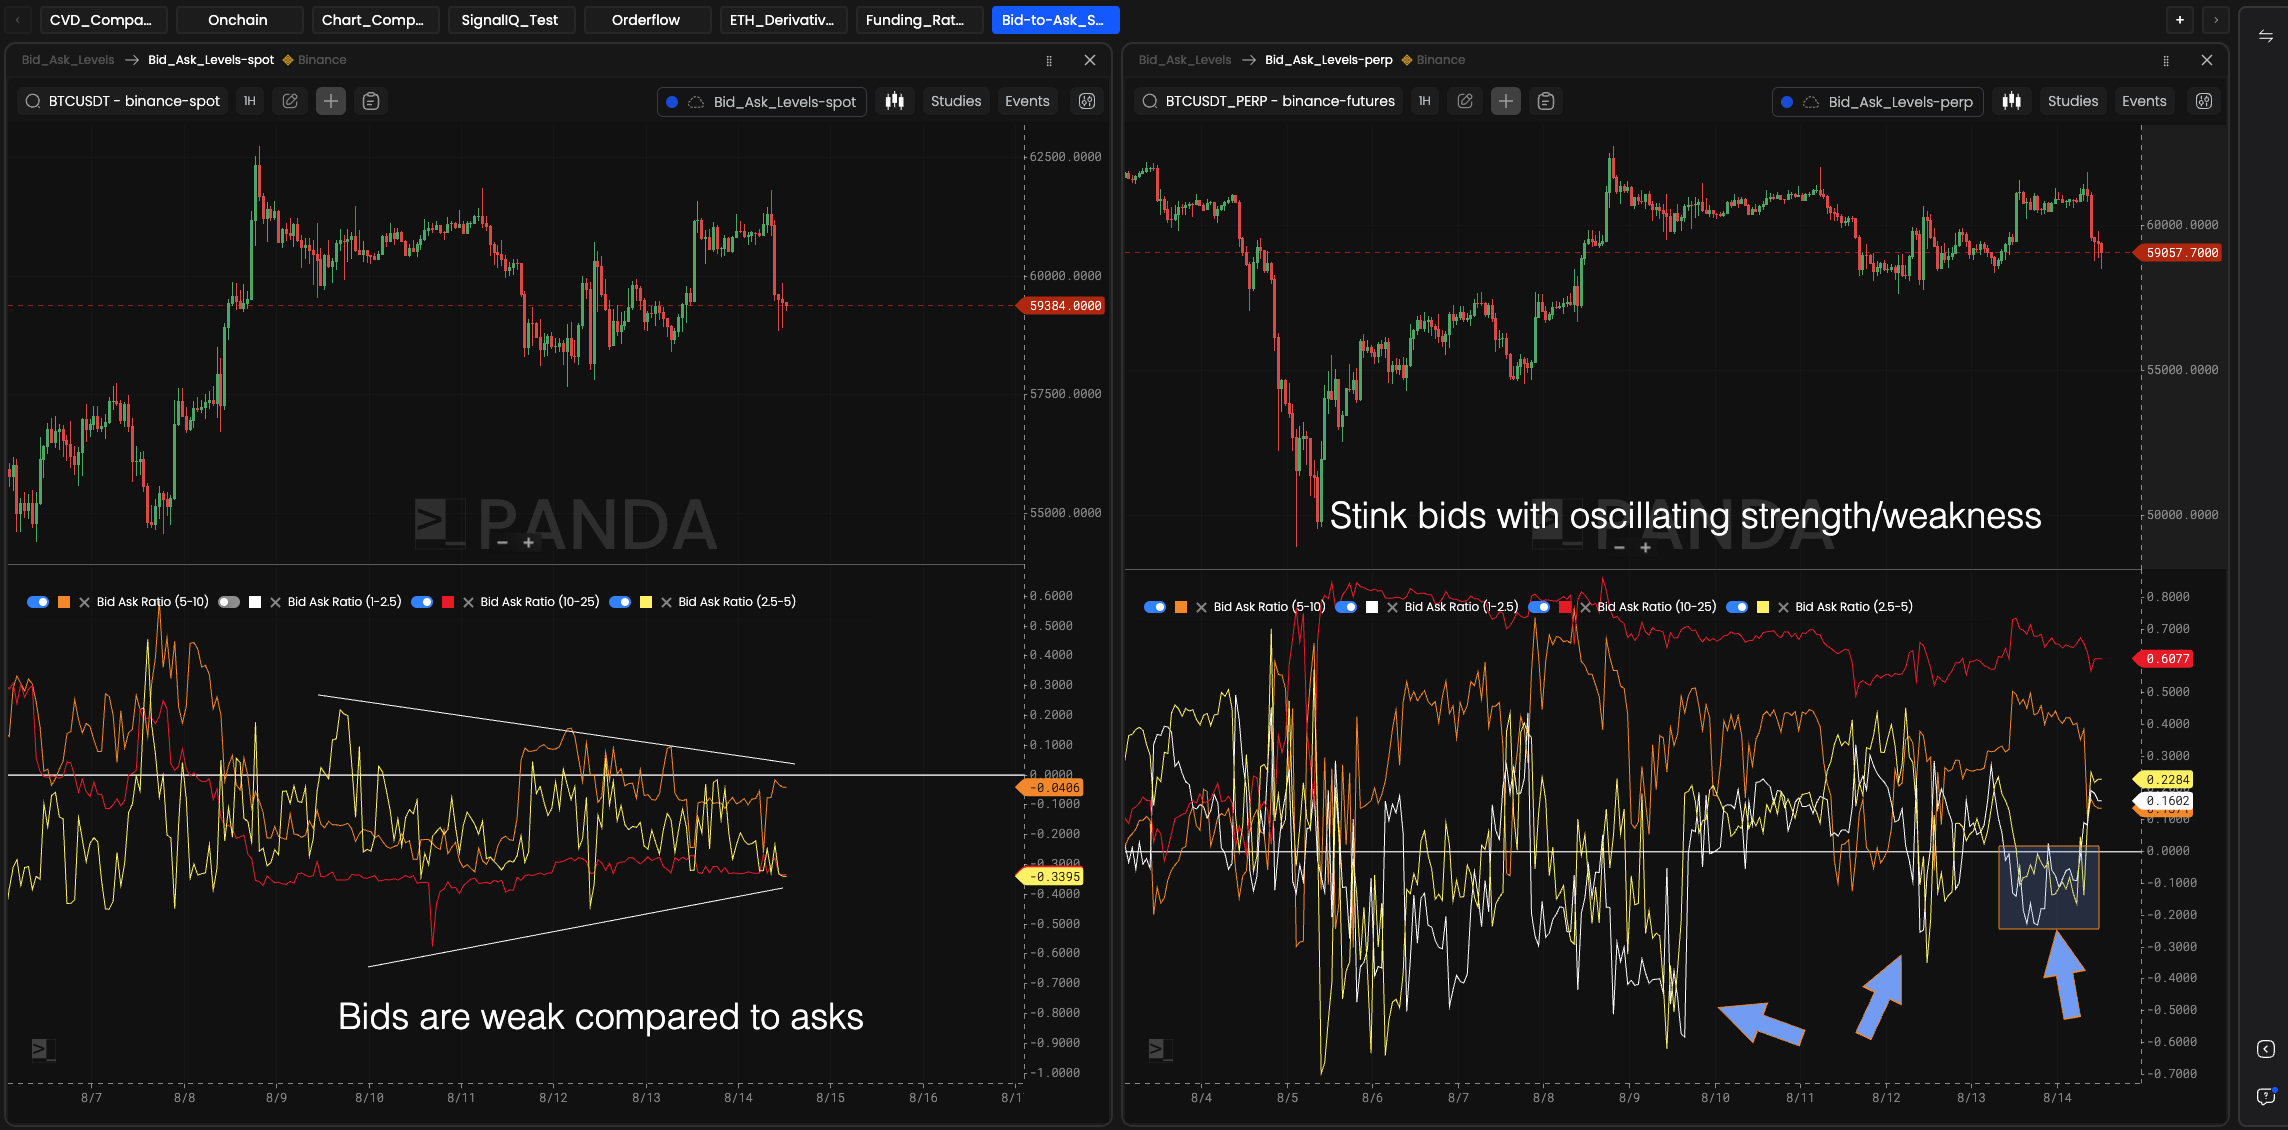
Then on the right-hand side we see Perps are showing mid-term fluctuations between 1-5% depths. This is the white and yellow lines that the arrows are pointing at.
This range is the most responsive to future price moves over the last week.
Today, we see that asks were stronger, and price lost the $60k level.
These small fluctuations are nothing to really dictate larger trends though.
If I run through exchange metrics, more orderflow metrics, and even onchain metrics, we start to see a similar message... The market lacks a rudder. It's unable to really decide what the trend is.
Even whales exhibit this indecision.
The red box below shows Whales are not accumulating. The green box is to show what strong accumulation looks like... Which is great to see when price is rallying... Or even better, just days before price rips higher out of a sideways range.
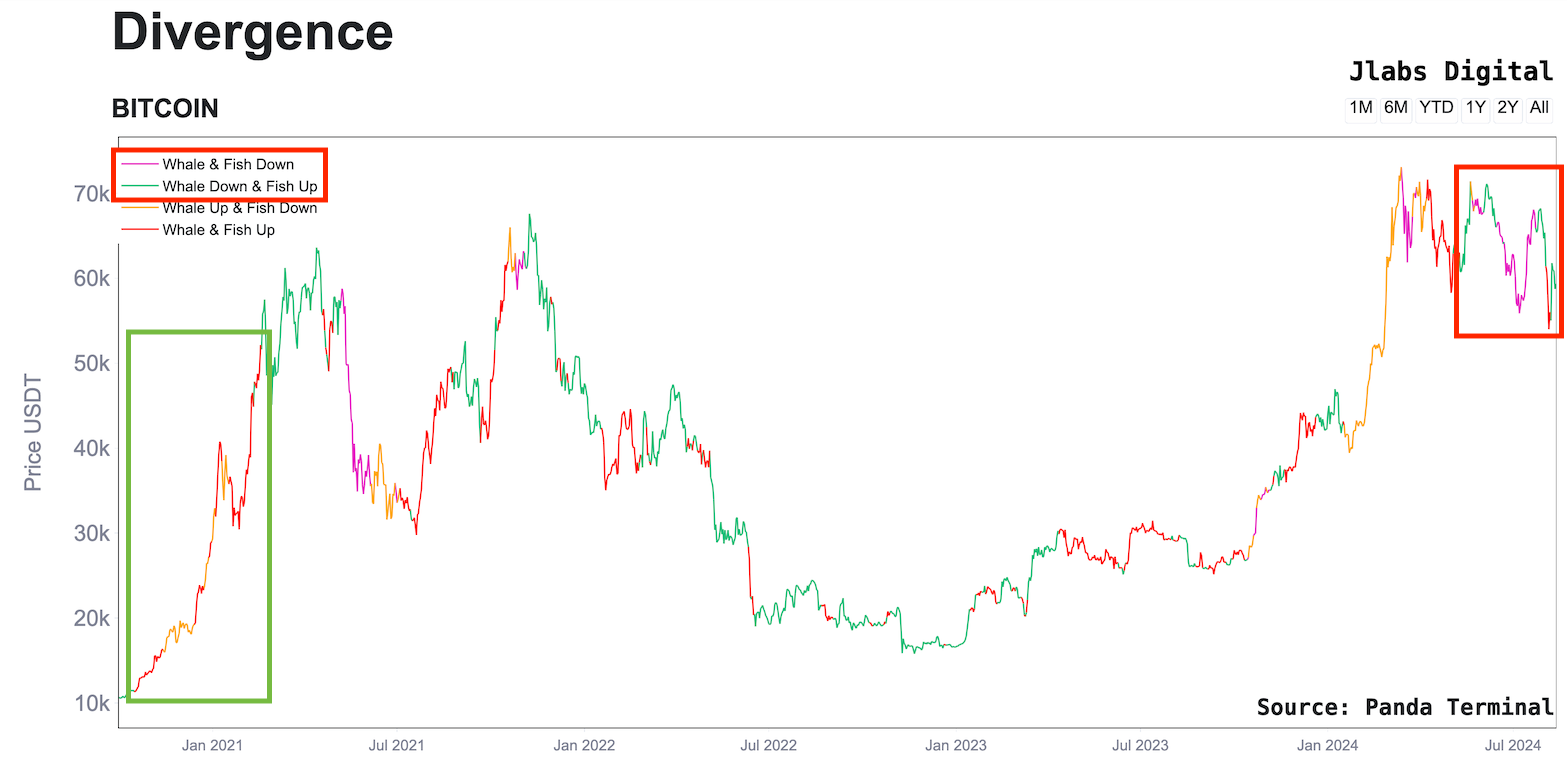
There are more metrics that I could show that paint a similar picture. But what I think summarizes why we are rudderless is the most basic technicals of all.
Price is looking up at the 200-day moving average, not down.
Here's the money shot...
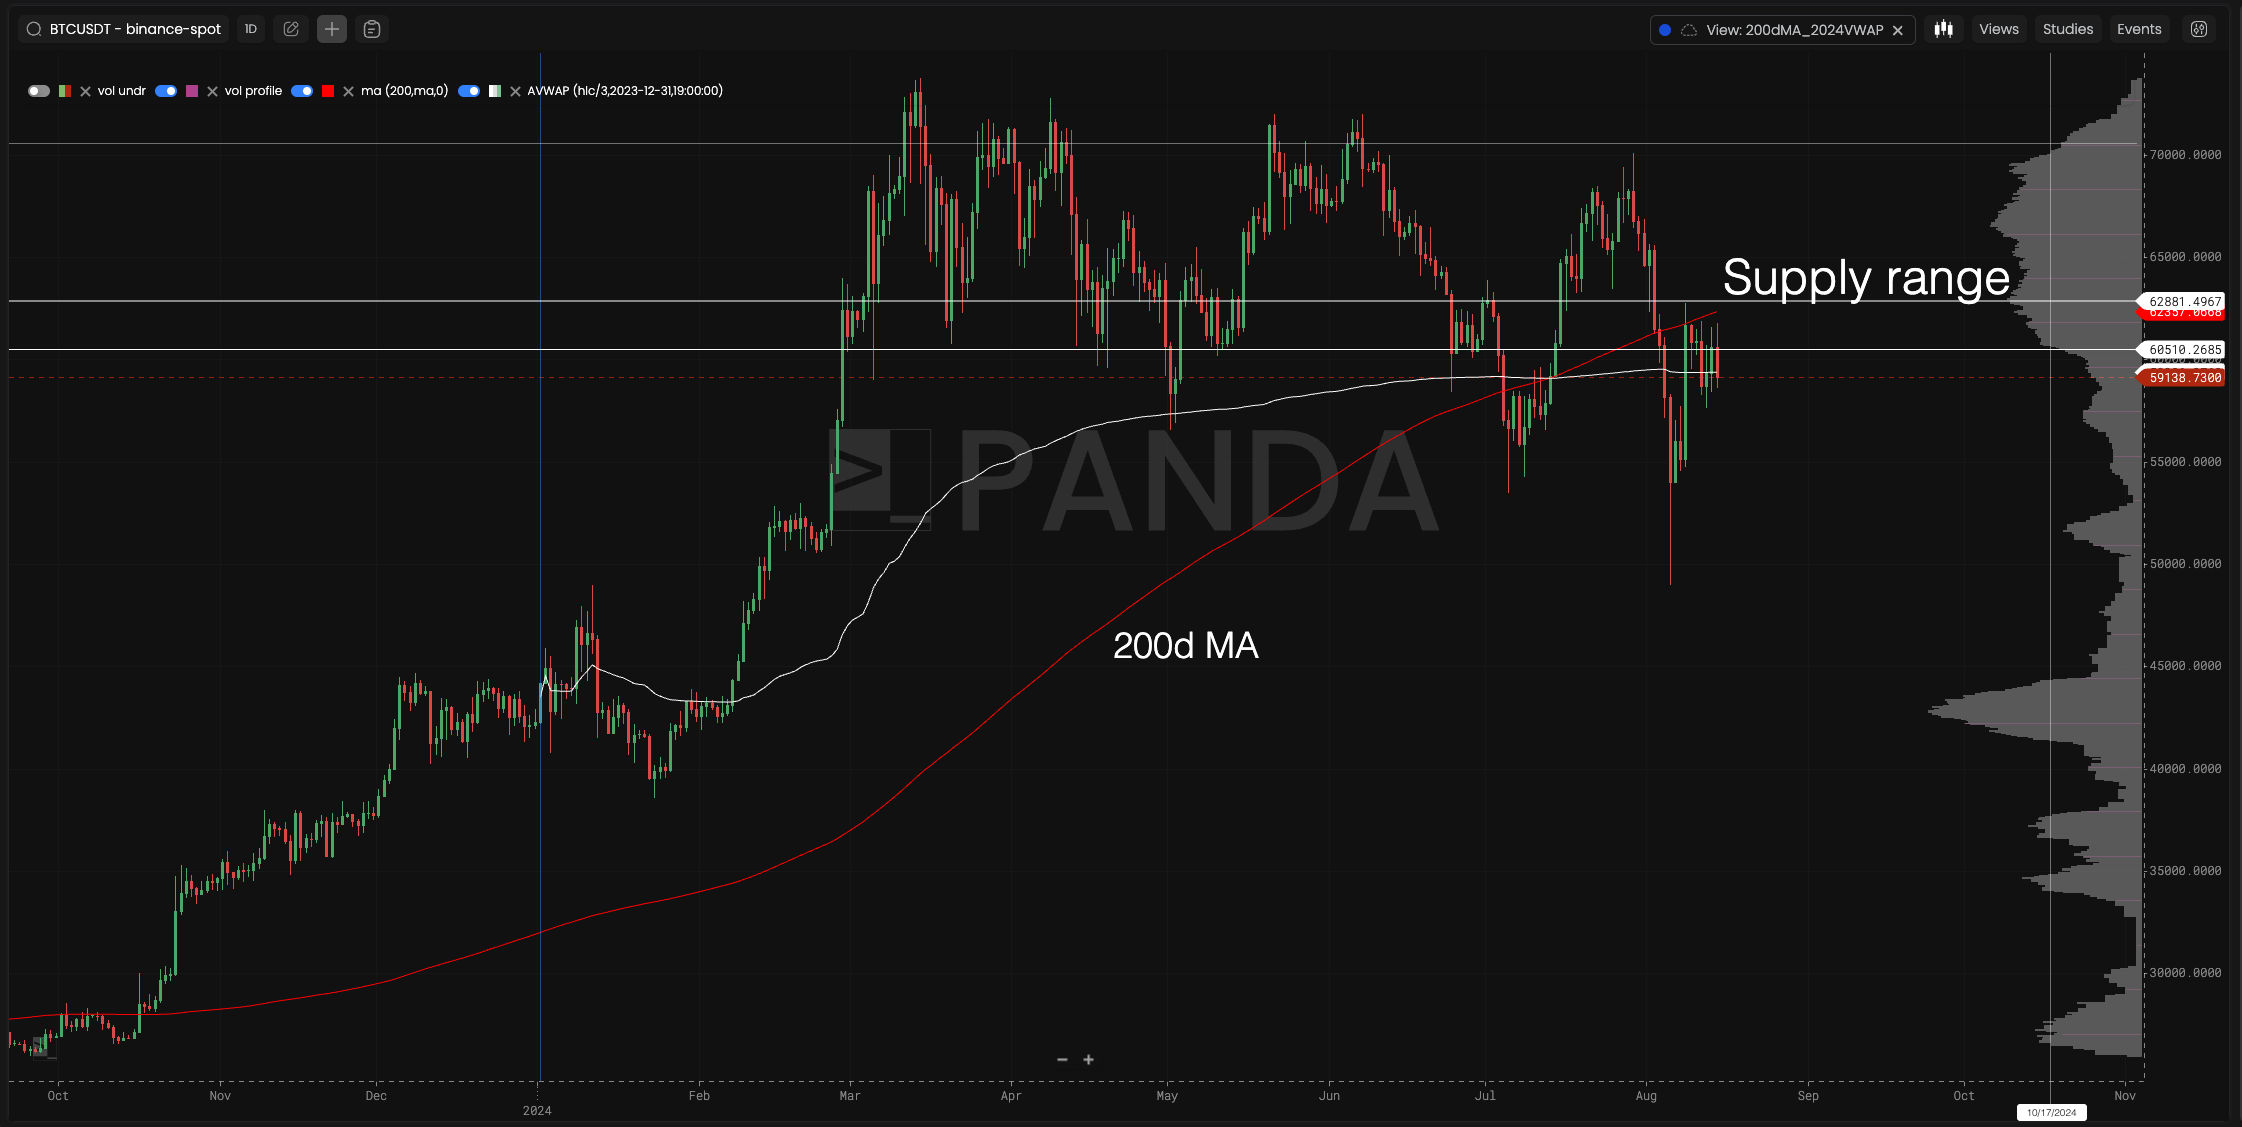
And what's funny of all this analysis and writing is that Benjamin, Managing Partner of Jlabs Digital who heads the Quant department, summed it up best in last week's Trading Pit show. And I paraphrase...
Price is below 200-day moving average, what more do you need to know?
He seems pretty spot on.
It's this reason right here that we drift sideways, rudderless... Leaning on the oceanic current to give us direction.
Thanks for reading. And be sure to tune in to tomorrow's Trading Pit. I'll post the link in our Telegram chat about 10 minutes before we go live (9:15am ET / 13:15utc). I'll be acting as host for the next two weeks as Marconi tends to a higher calling. We love him, and can't wait for him to come back.
Hope to see you there.
Your Pulse on Crypto,
Ben Lilly
P.S. - We were grateful to have the boys from Kingfisher on xChanging Good last week. Be sure to give this interview a listen as they break down some topics that are sure to level you up as a trader.


