Déjà Vu
Notes From the Lab: Meet JJ, the Janitor

The Nebuchadnezzar crew is walking up the stairs of their headquarters.
As Neo (Keanu Reeves) gets closer he notices the same black cat from just moments earlier...
Confused, he smirks and shakes his head whispering “déjà vu” as he continues walking… unaware of the implications.
Immediately after hearing the words “déjà vu” the more experienced co-hero Trinity, goes on high alert. She starts by pressing him for more details.
She goes on to explain, déjà vu means there is a glitch in The Matrix, it happens when they change something.”
The crew is attacked seconds later… What a great scene.
Basically, in the film the antagonists used code to alter appearances inside the VR world to set up an ambush. Neo and company had been led into a trap, and the only thing that saved them from total annihilation was the recognition of déjà vu.
And earlier this week as I came into the building for the night, I noticed one of The Bens (Benjamin) rifling through data and charts on a day where the crypto markets were pumping.
At the time ETH was in the process of eclipsing 50%+ gains from the recent lows…
Word has it that black cat was seen in the historical volume data.
The FTX leader board showed Ethereum perpetual futures contracts (ETH-perp) were the most heavily traded product on the exchange. And this wasn’t the first time its happened.
You see, BTC is not only the leader in crypto by market cap, but the daily leader in perp trading volume.
The anomaly of the ETH-perp outpacing BTC-perp was the black cat in the room.
Anxious to find historical precedent the team entered the lab, back tested the data, and left some charts behind… Which I will share with you today…
Hi everyone, my name is JJ - the night shift janitor here at Jarvis Labs.
Once I started working here I noticed the professors of Jarvis Labs frequently leaving up charts, reports, and even equations on the whiteboard once they finally left in the middle of the night. The stuff seemed pretty important, so I started interpreting these things for myself.
It wasn’t long before I realized it was like trading cheat codes. And lucky for you, my friend is sick of hearing me talk about it.
Every week I will try to share the coolest and most exciting thing I find laying around the halls of Jarvis Labs. I hope you like it because if I get 1,000 followers on Twitter (@JLabsJanitor) my friend will buy me a pizza.
So be on the look out for “Notes From the Lab” from me, JJ.
The Ambush
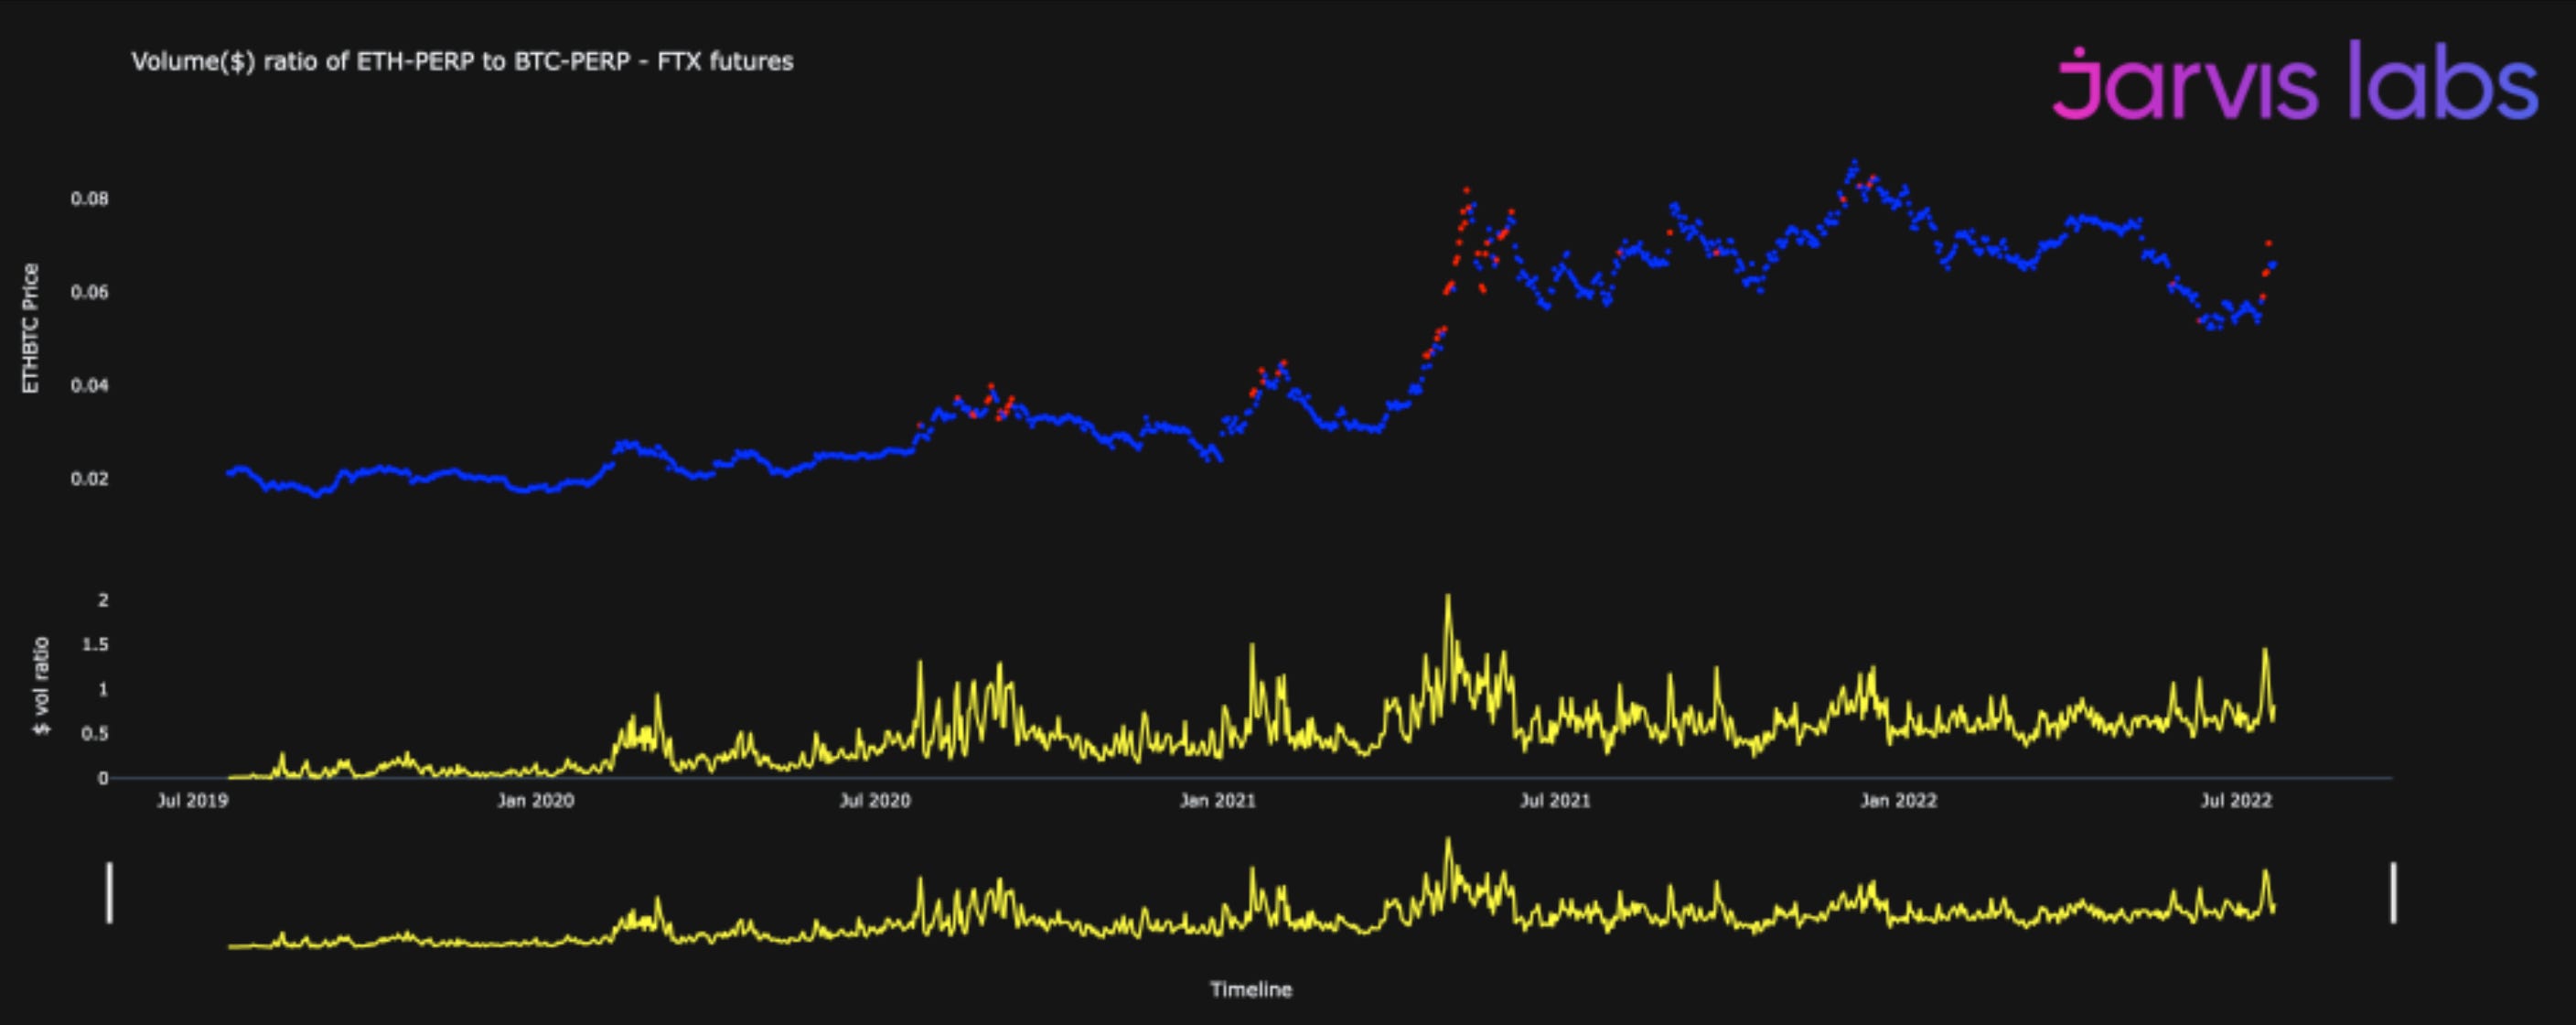
OK, so the blue line in the chart below represents the ETH/BTC price ratio. This ratio shows us the exchange rate between ETH and BTC.
As I write this down it is roughly ~0.068, which means 1 ETH buys you .068 BTC.
When this ratio rises it means ETH is the stronger market, when it falls it reflects BTC is dominant.
The yellow line on bottom represents the volume ratio of the ETH-perp vs BTC-perp contracts on FTX.
A ratio of >1 means that the ETH-perp is leading the market in volume – a black cat moment.
When the ratio exceeds 1 it registers a red dot on the ETH/BTC exchange ratio - blue line. These red dots warn us that what we think is a trend change rally may be little more than a well disguised trap - the black cat.
Tracking the red dots vs price below you’ll see its ability to signal unsustainable market conditions is really good.
What’s more important here is that a fresh batch of red dots just showed up, here’s the chart I found…
Not only does this not bode well for the ETH/BTC ratio, it’s also likely tied to the broader market as well. It may lead to a correction for more than just BTC or ETH.
Here is another chart I came across. It is a bit similar, but this time instead of ETH/BTC it is the price of BTC. Take note that the last time we got this sell signal, it was just before the market crash began in mid-June and before the larger rally in Q4 2020.
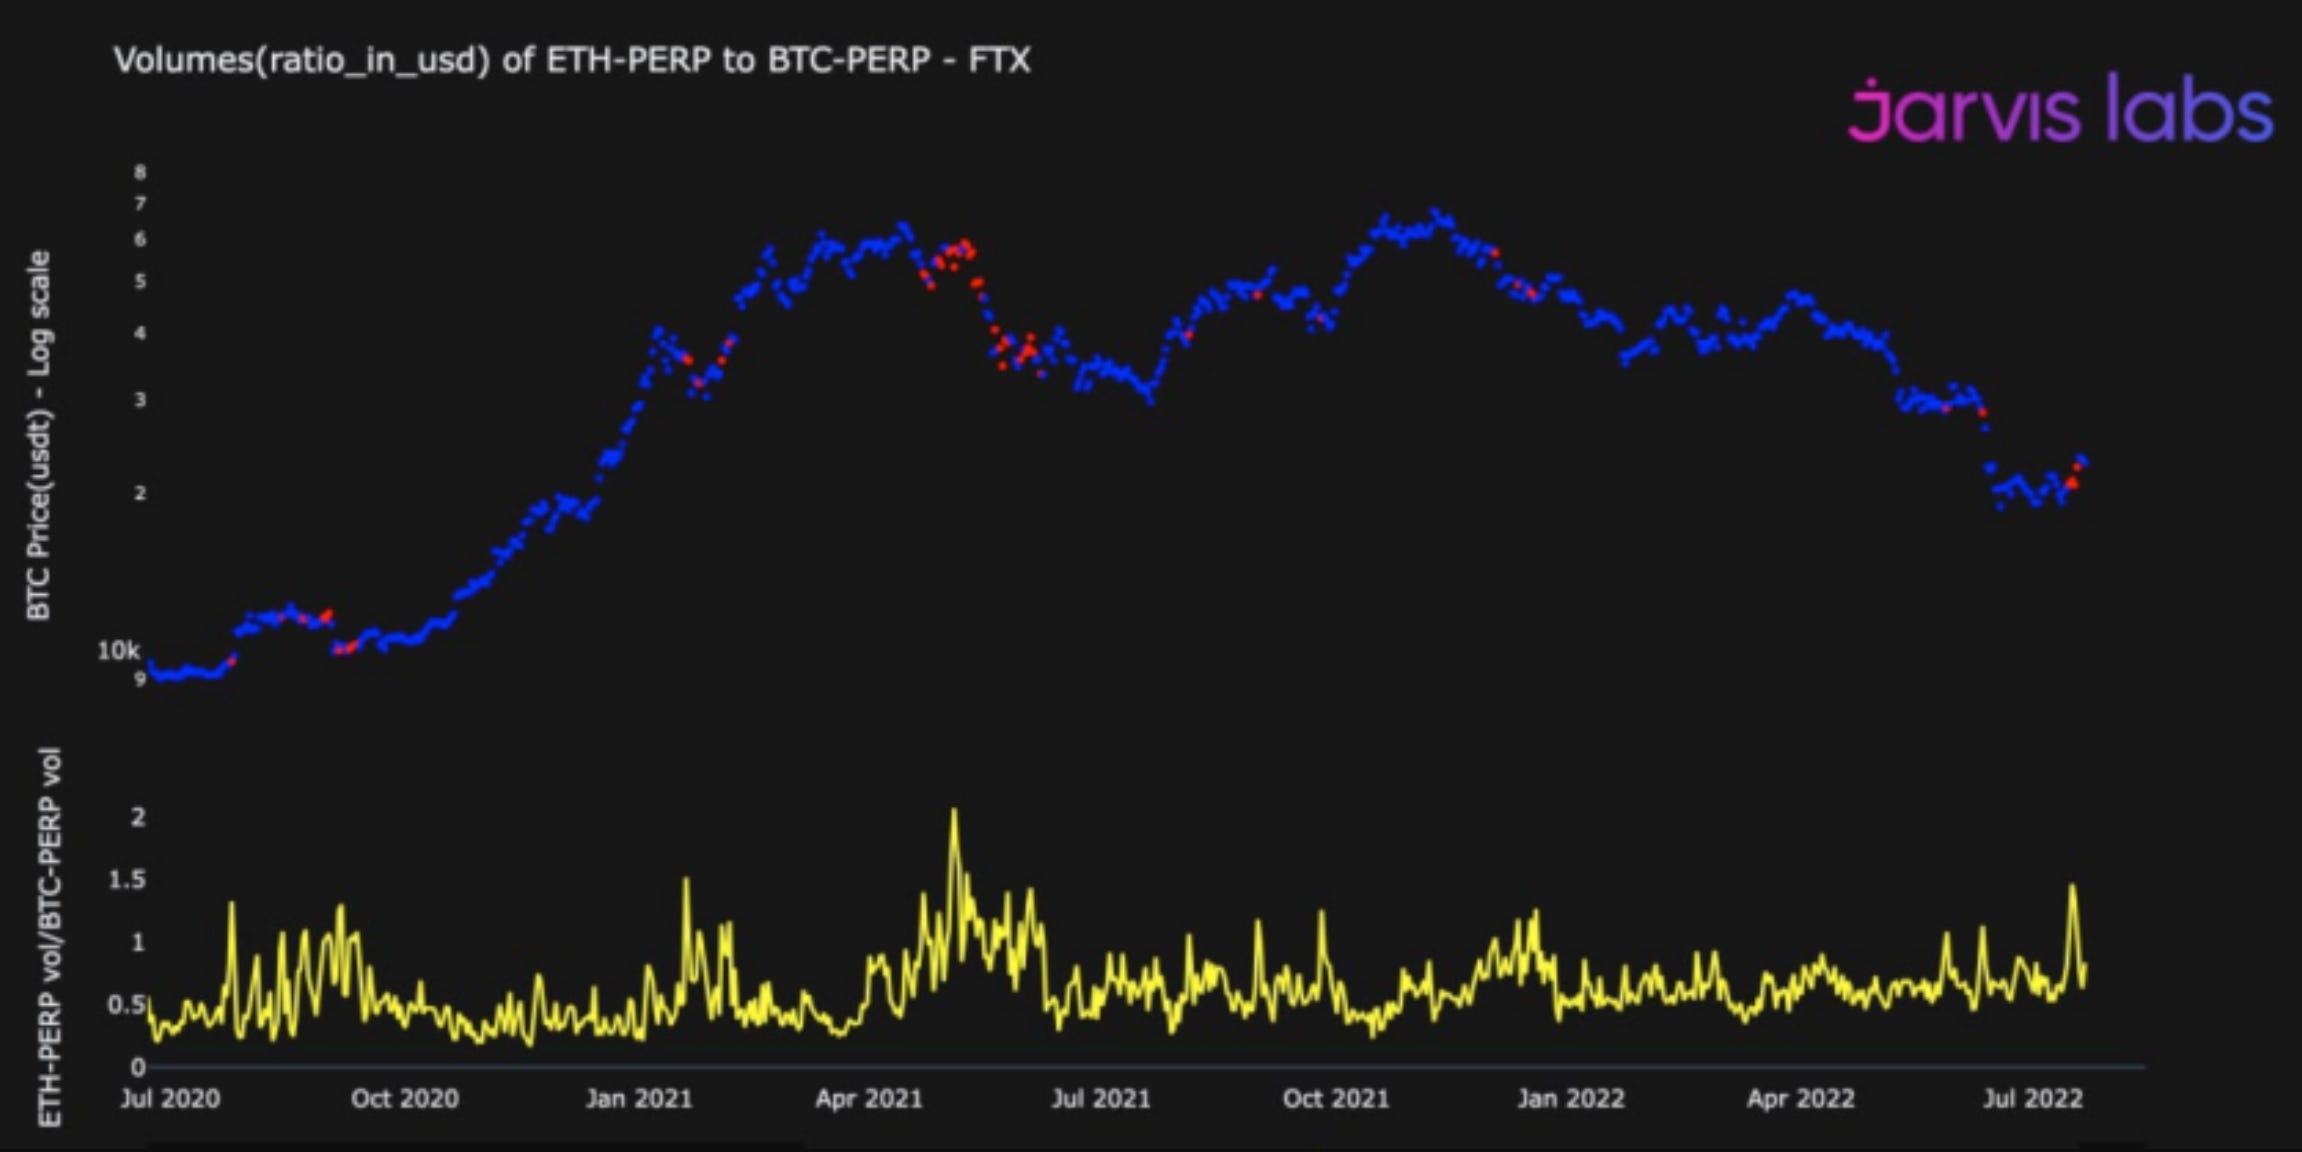
This alone is not a sure fire thing that the top is in. It’s more of a cautionary chart that seems like it can be paired with other indicators the Jarvis Labs team uses.
If anything, this is a great chart for any trader deep in profits who has yet to lock anything in yet… At least until the global financial debacle becomes more favorable.
And anybody sidelined or experiencing FOMO from this bear market rally, no reason you can’t stay calm and wait for things to clear up more.
Keep in touch,
JJ


