BTC is Still in Accumulation
Identify potential market tops & bottoms


The bull market keeps rising higher, and so do our hopes. But then it takes a significant dip.
The question on every trader’s mind is, ‘Was that the peak? Should I sell, or should I buy more?’
To help decipher if the market is reversing, we ought to track the right metric. We use exchange netflows as this metric. You might have read this term before in Espresso.
Here’s how it works.
Daily exchange netflows are calculated based on the difference between BTC inflow and outflow from the exchanges.
Typically, a high positive netflow is bearish as more BTC is available on the exchanges to sell.
Likewise, a high negative netflow indicates accumulation and an intention to HODL outside the exchanges.
Hence, netflow can be an excellent indicator in identifying market tops and bottoms. The key is knowing where we are in the cycle.
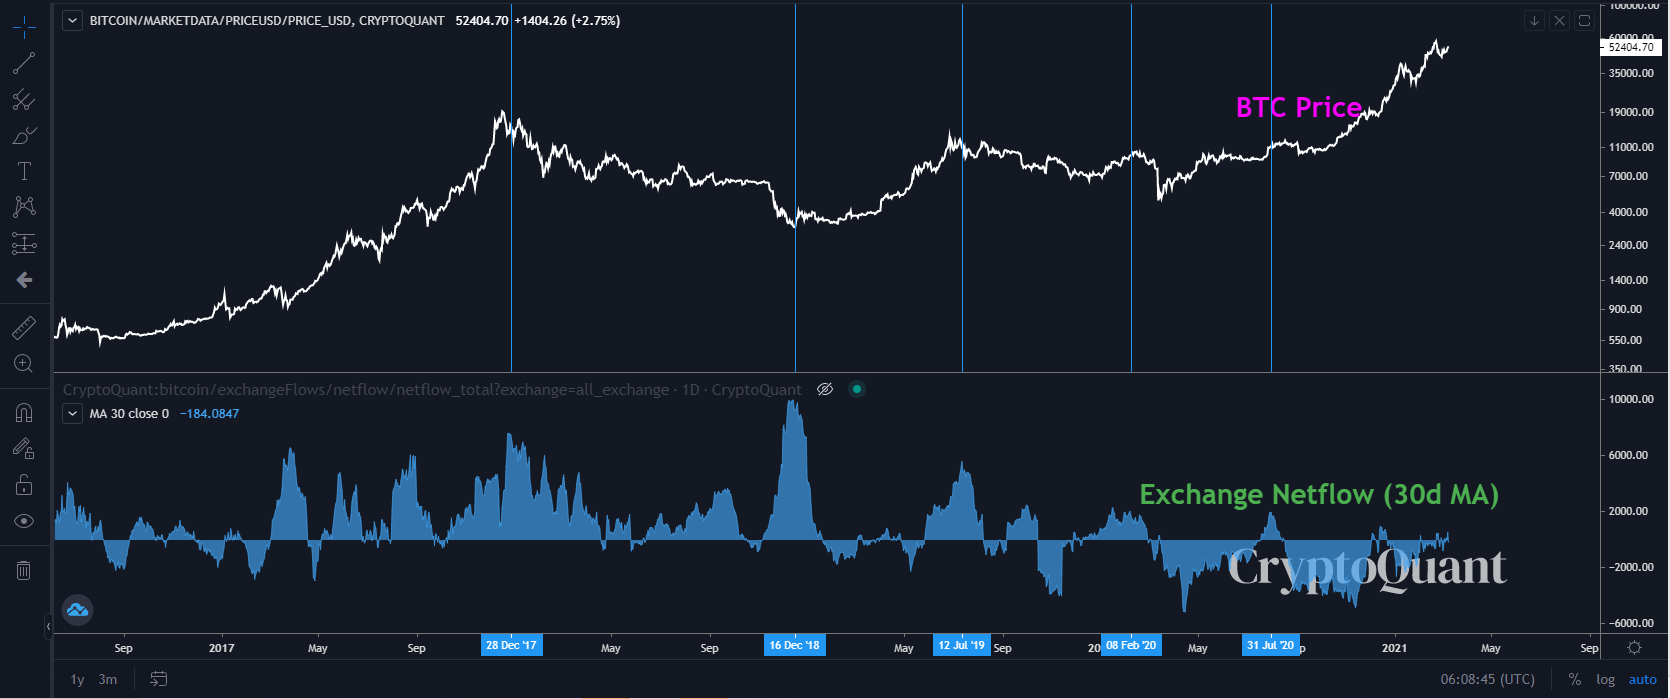
(Here’s the chart to identify the cycles)
As you can see in the chart above, on five dates (December 28, 2017, December 16, 2018, July 12, 2019, February 8, 2020, and July 31, 2020), Exchange netflows spiked. Observe the vertical blue lines highlighting these spikes. You can see where the price was and what happened afterwards.
Peaks in netflows can indicate potential reversals in market cycles.
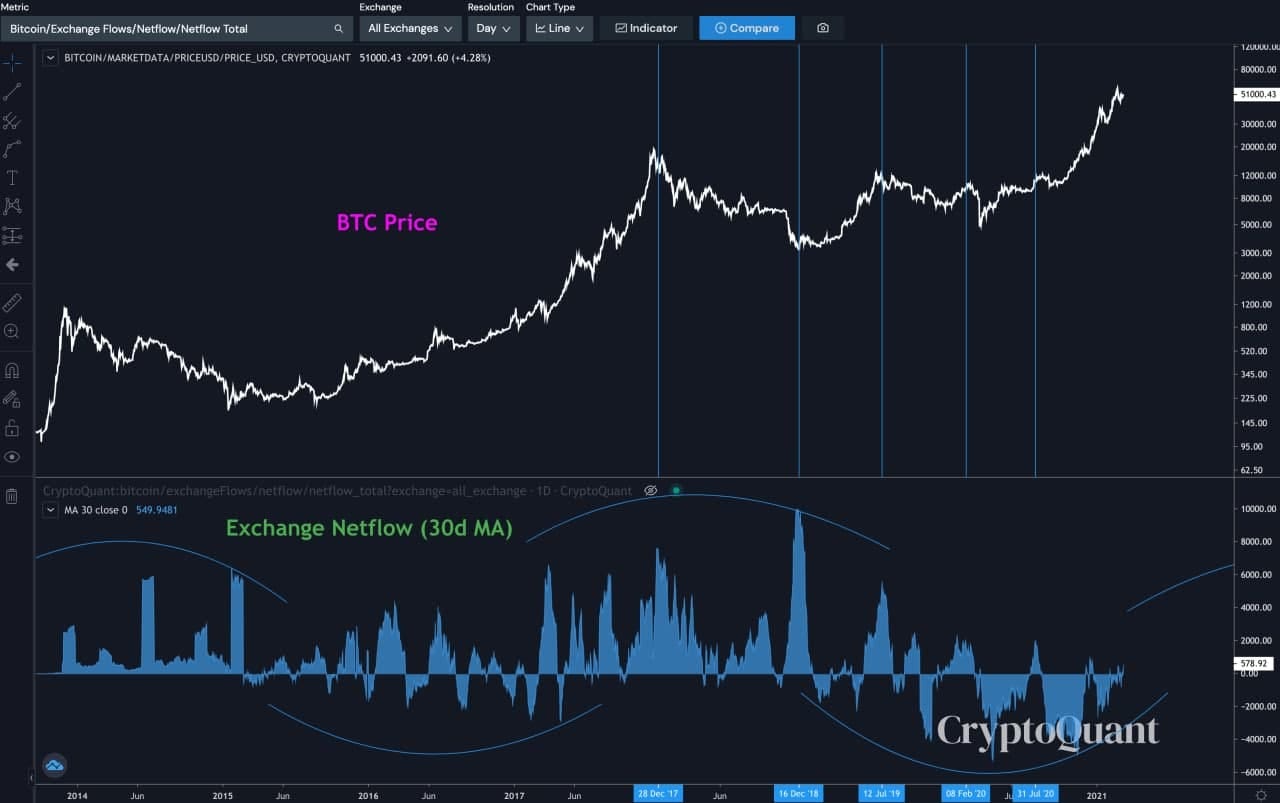
BCH (Bitcoin Cash) Hard Fork in 2018 led to panic and fear in the market. It resulted in massive amounts of BTC being sold by the miners and whales and BTC moving to exchanges. This peak in netflows preceded a bottoming process where netflows turned negative - an accumulation period leading to a nearly 4x rise in prices in the following months.
Over the last four years, peak values in netflows have helped in identifying potential reversal points.
For the past eight months, netflows have been mainly negative, indicating that BTC is still in a vertical accumulation period. The expansion is yet to come. The top is not in.
The best way to stay ahead of the rest is to post an alert on the 30-day moving average of BTC exchange netflows at 2,000.
When the alert pops up, it will be time to pay attention, take caution and book some profits on your spot holdings.
We plan to reference this chart during this bull cycle to help identify if the opportunity presented to us is a ‘buying the dip’ or ‘selling the top’ moment. Until then, sit back and enjoy the ride!


