Boredom Begets Opportunity
Market Update & Options Insight: 2 Feb 2024


It’s the weekend.
I know many of you were checked out this week. And I get it. ETF happened, prices softened, and now we are going sideways.
It’s also why I haven’t written much. I can see many of you have checked out this week and need a little break.
All good. So I’ll keep this one pretty short. Also, because I want to give way to our man steering us to the promise land via Options, JJ.
I asked him if he’d like to start writing a quick update on the options market each week. Ideally it’s a shorter piece that helps showcase why options are very pivotal to understanding market structure.
But before I pass the reins to him, I’ll drop some data points to help get you through the weekend.
Enjoy!
Market Update
Jerome speaks, we listen… Sometimes.
The Fed is doing pretty much what we expected… Underdelivering on what the market expected. The market believed rate cuts were to be coming in hot and heavy in the second quarter of this year, Jerome squashed some of those beliefs in the recent presser.
You can see the market’s recent reaction in the teal line below spiking up quickly over the last day. That’s the market pricing a higher chance of no rate cut in March.
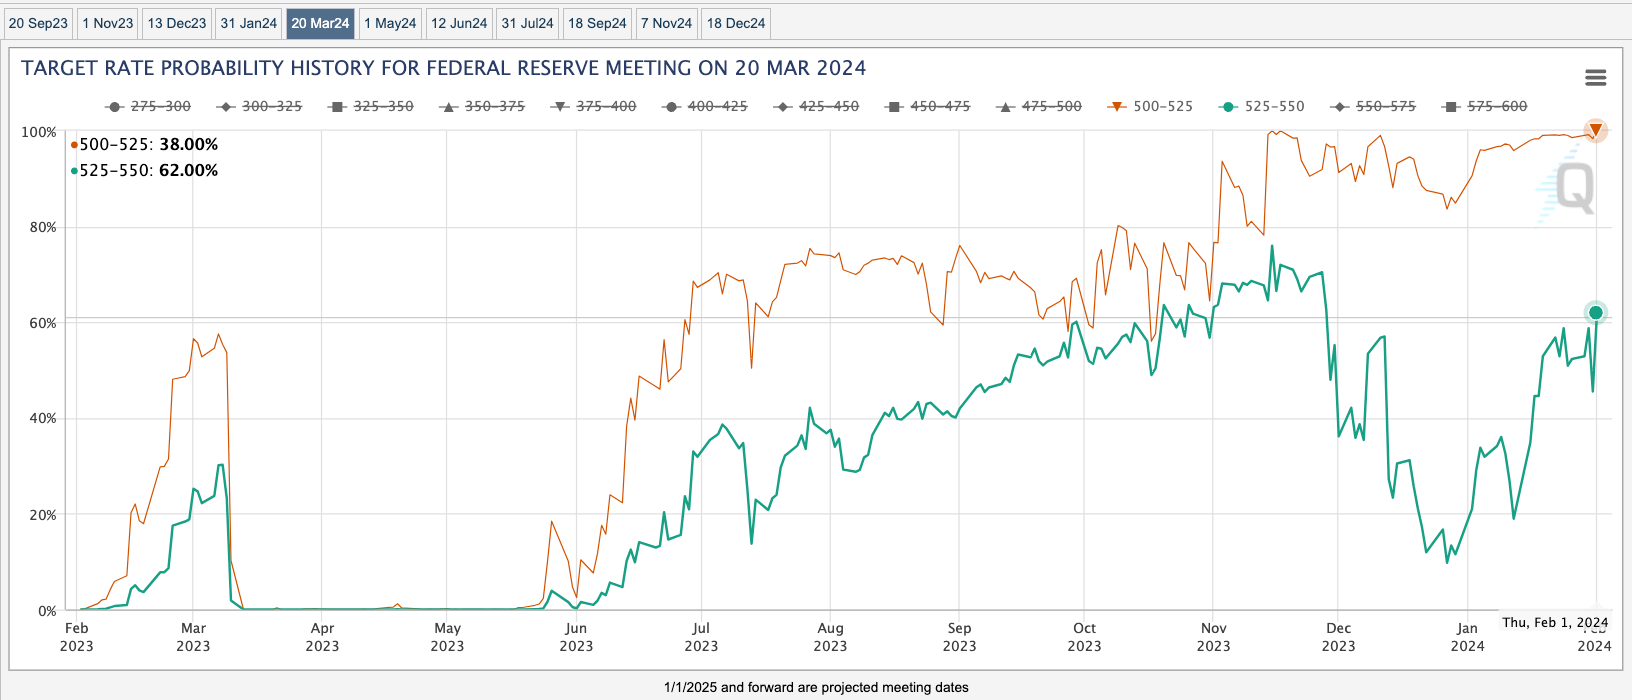
I’d expect in the weeks to come that the May and June FOMC expectations begin turning slightly less dovish on rate cuts as they haven’t really re-priced themselves as much as the March FOMC probabilities in the chart above. This would be a bit of a headwind in the coming month for markets as this re-pricing works itself out.
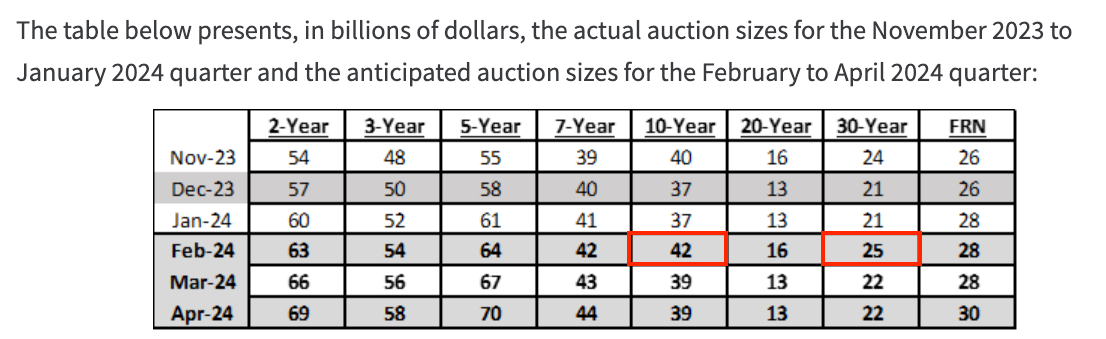
The U.S. Treasury also made its announcement this week on how much debt it plans to issue in the coming months. Janet Yellen said there would be less, but that doesn’t seem to show itself in this table. But then again, maybe she initially planed to roll out more, so it’s “less” relative to her own expectations… Who knows.
Regardless, those two red boxes are auctions I have my eye on for February.
I would expect those two auctions to show themselves in this chart below. It’s the DXY in green compared to the 30-year yield. They are tracking very similar.
Intuitively it doesn’t make a whole heck of a lot of sense to me. U.S. government issues more debt at higher rates at longer duration results in higher yields and a higher DXY… Hmmm.
Curious what you all think on that one as the logic all holds fine on the shorter durations due to the various rates in money markets like federal funds rate, SOFR, repo reward rate, discount window.
The only thing I can come up with is a stronger dollar means it’s harder to get more dollars, therefore yields rise on longer debt. Idk, I need to noodle a bit on it for next week. Let me know your theories in the comments so I can “borrow” it. Here’s the chart…
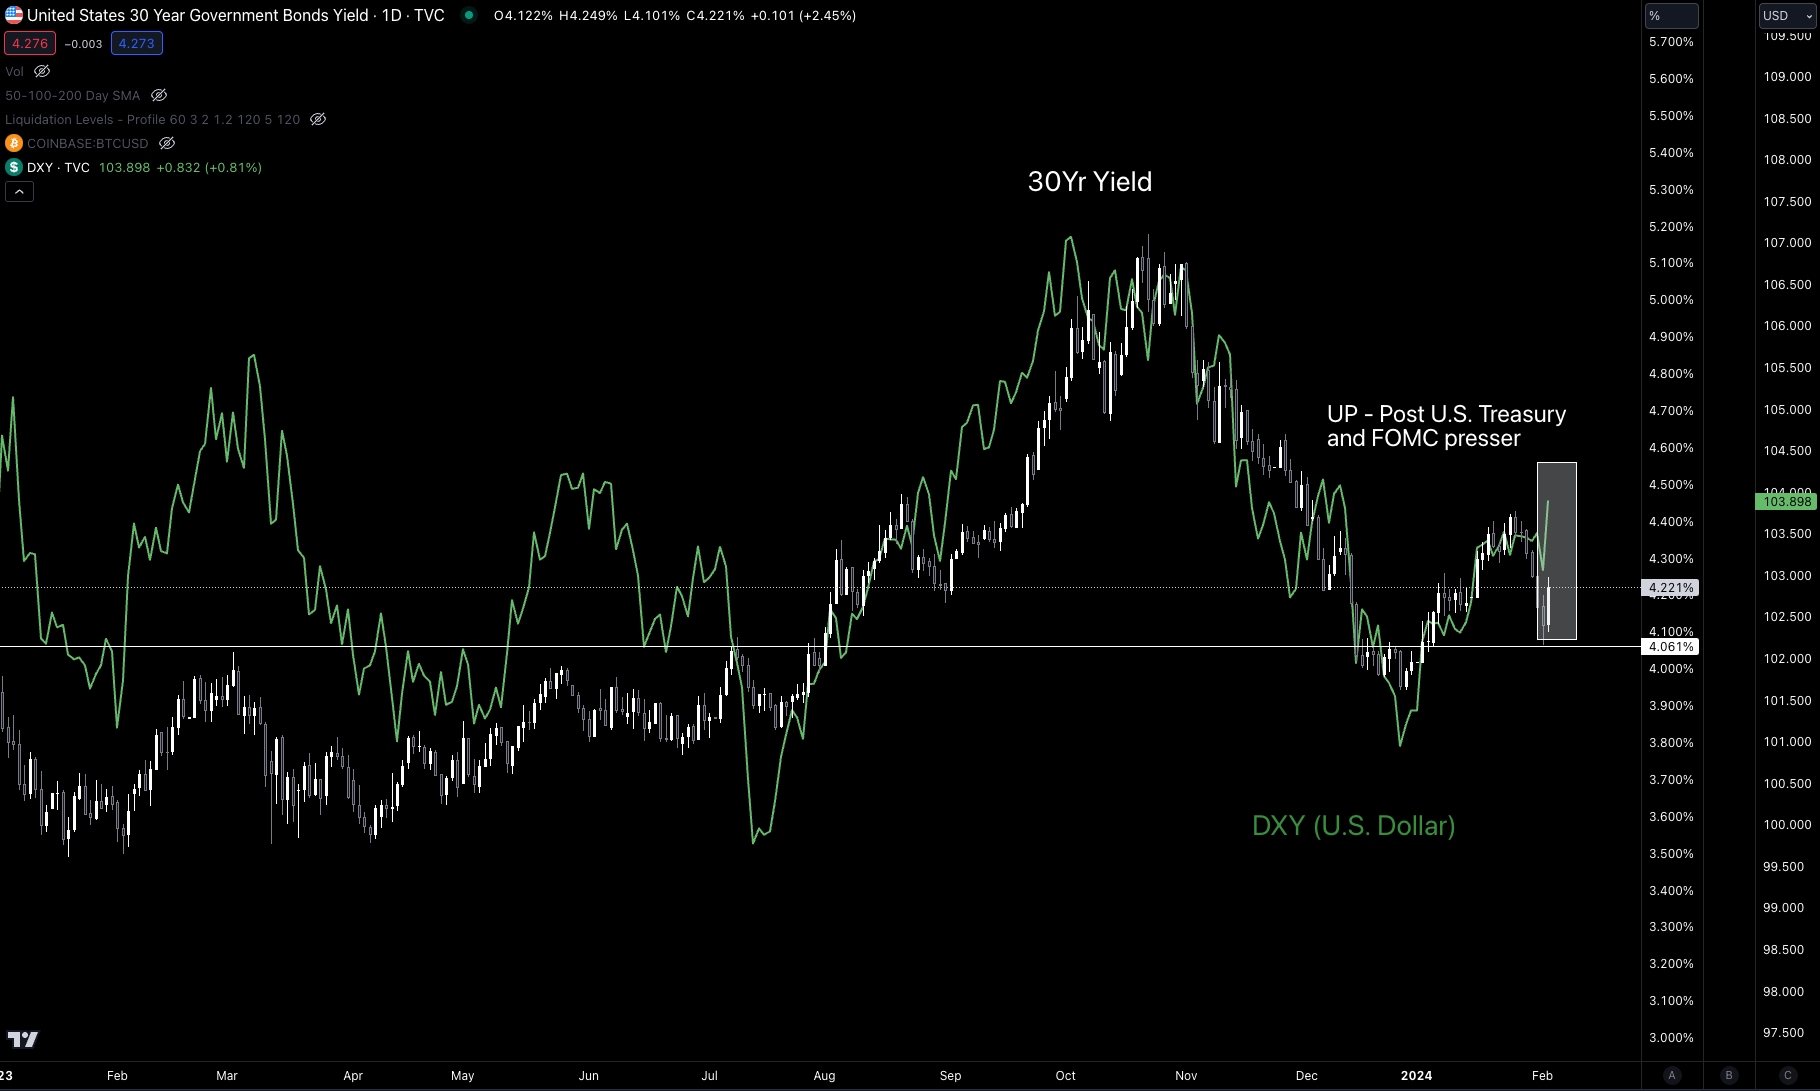
Again, a sizable uptick in debt getting issued on the 30-year in February. We saw yields get funky in September and October when Yellen said more debt issuance was coming at longer durations, they then had to use the eraser on those comments shortly after.
Now Yellen is saying “less”, but still issuing more. I’d expect the white and green lines to rise to about 4.5% and 105, respectively, in the coming month.
This should all line up with some bigger questions in the market such as repo facility, collateral requirements, BTFP program expiration, and more. Don’t worry about all those fancy terms as I’m still writing that piece to explain it. Hopefully I can muster up the energy to churn it out next week.
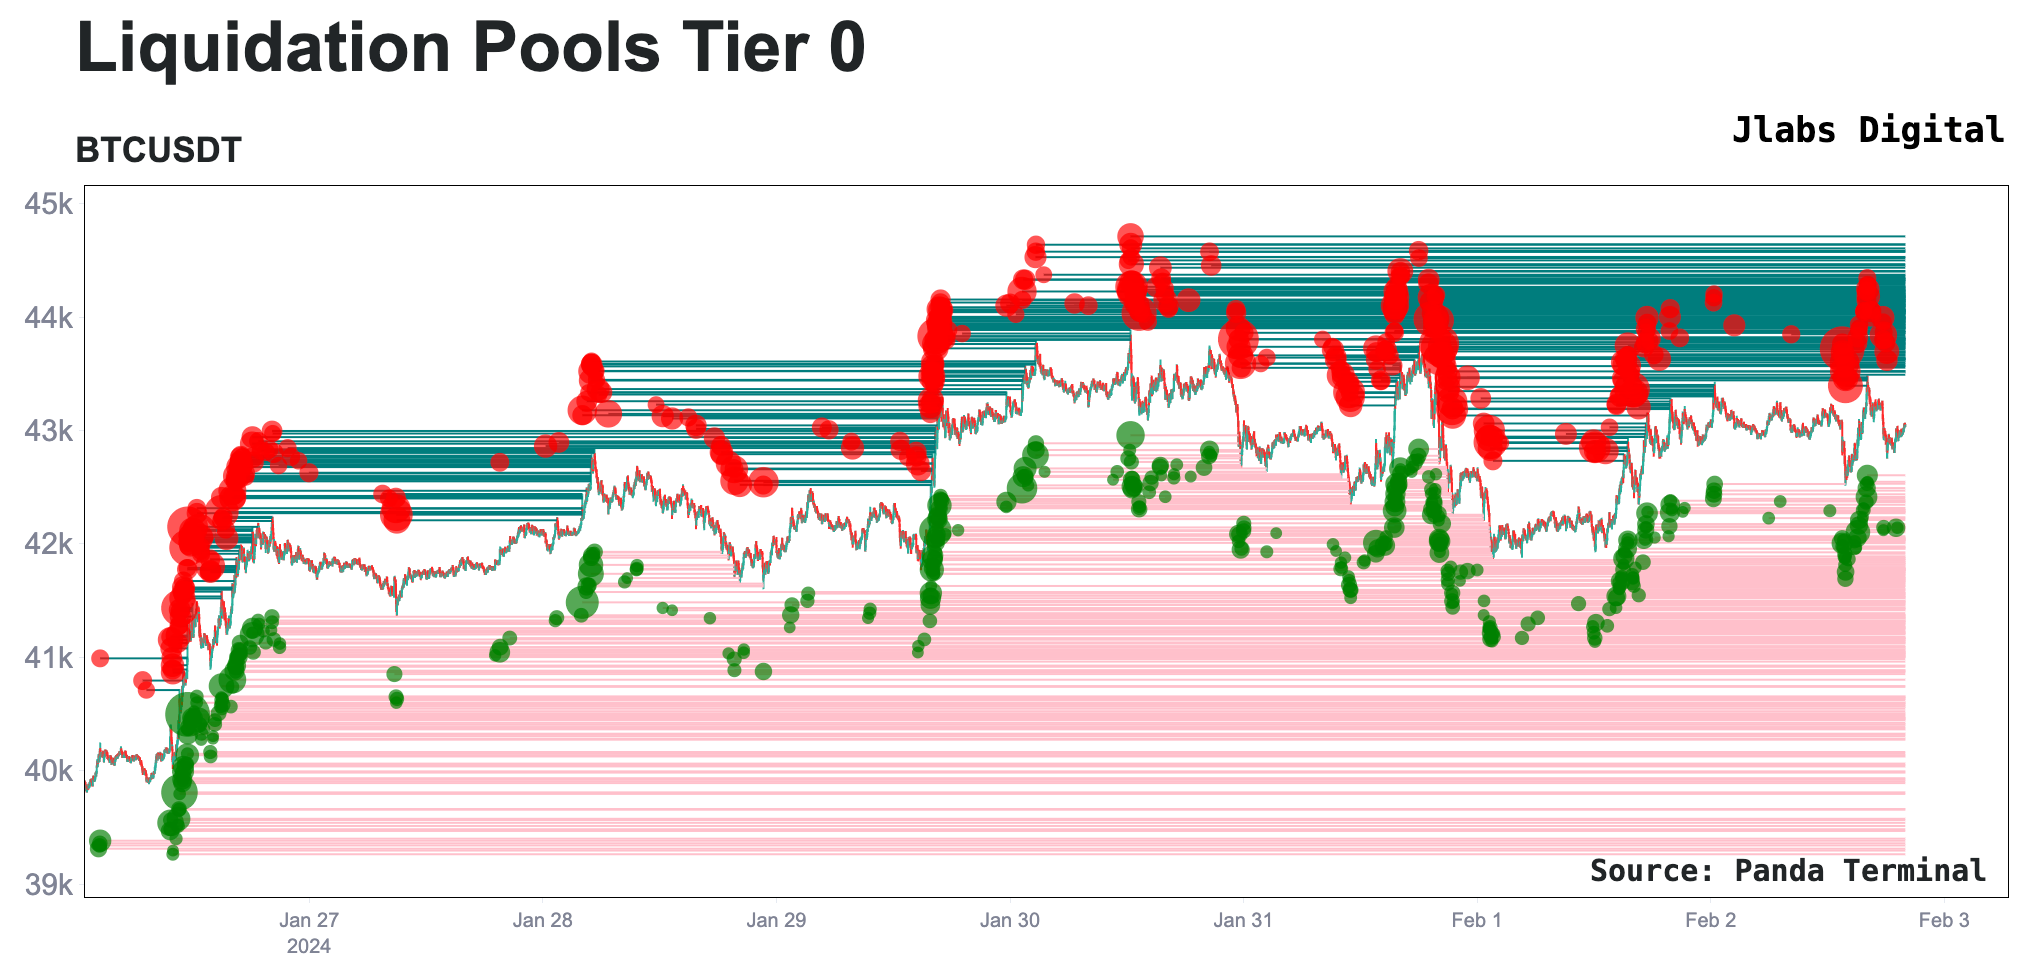
Until then, here are some liquidity pools for the weekend. These are the high conviction pools, which we filter out in the data. That’s why you don’t see a lot of bubbles. But if you’re into all those bubbles, I’ll post one in the P.S. section for your viewing pleasure.
Those green bubbles are sitting around $40k.
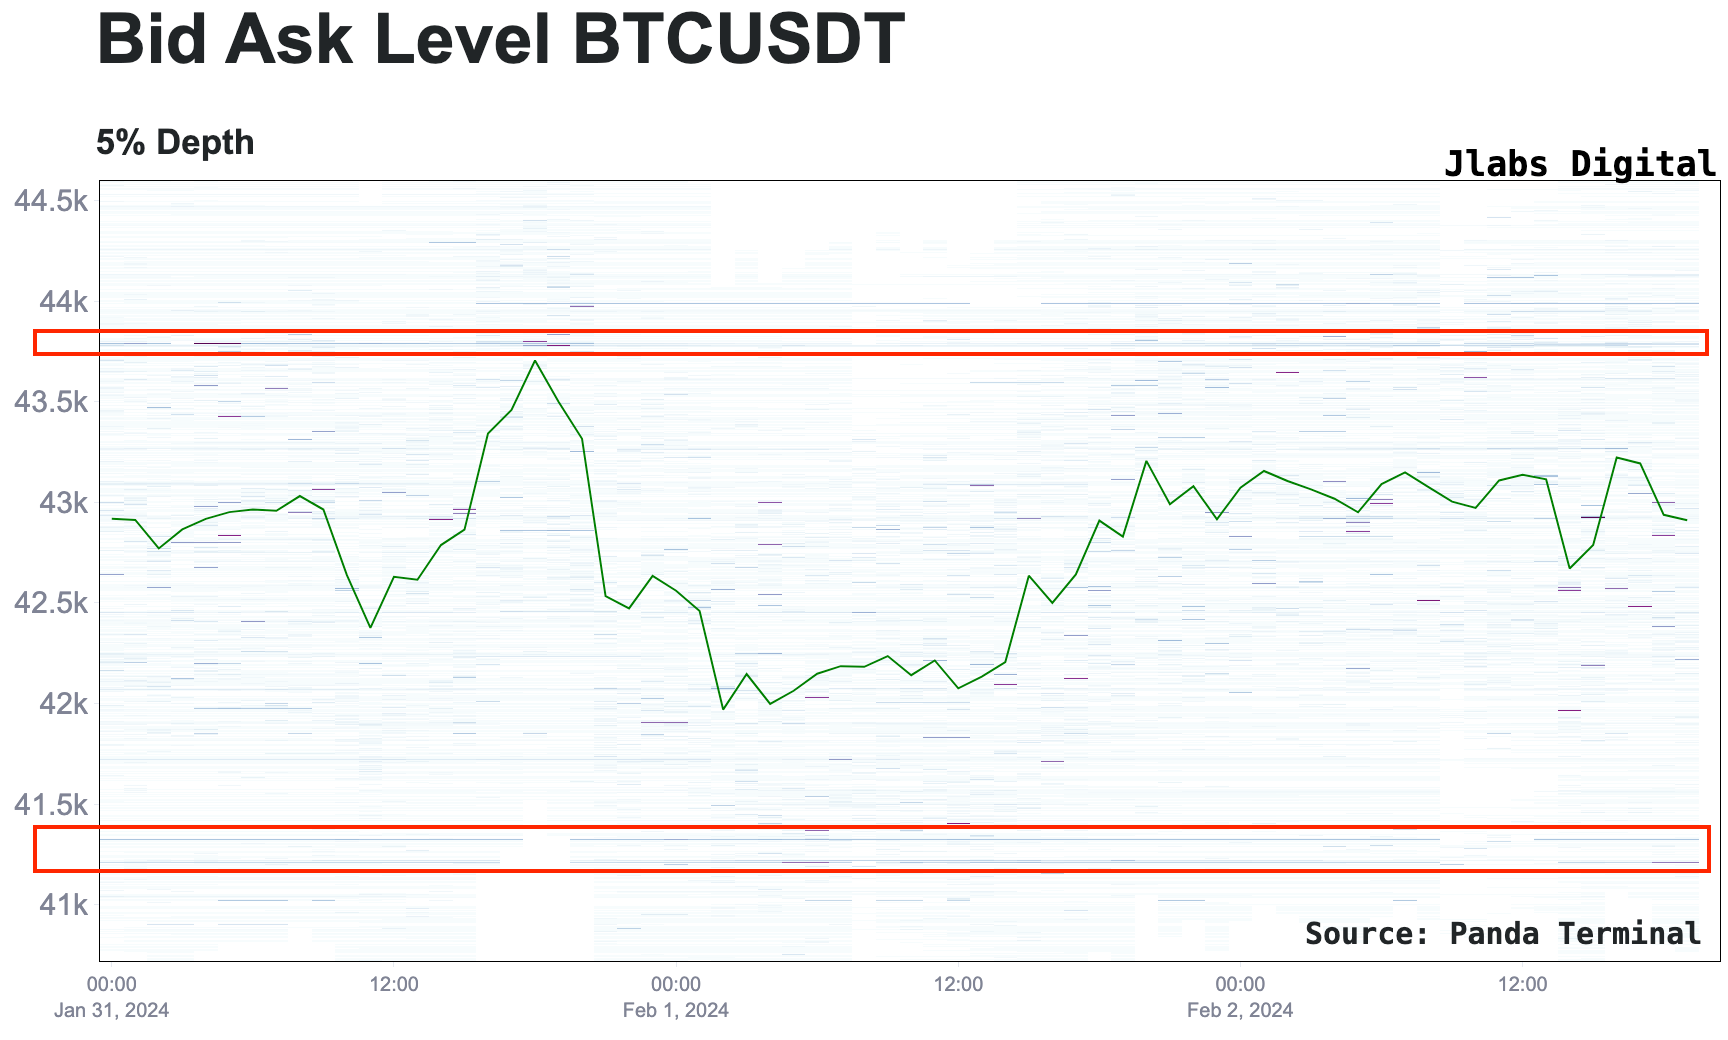
If we check out the orderbook going into the weekend, liquidity is a little thin. There’s a band of small orders between $43.7k and $41.3k. Not a massive wall or anything for the time being on Binance.
If we check out the bid to ask depth across exchanges we can better see if there are more bids or asks. There’s more asks sitting on Coinbase and Binance spot right now. Bybit has more on the bid side, but that tends to be more of a retail oriented exchange.
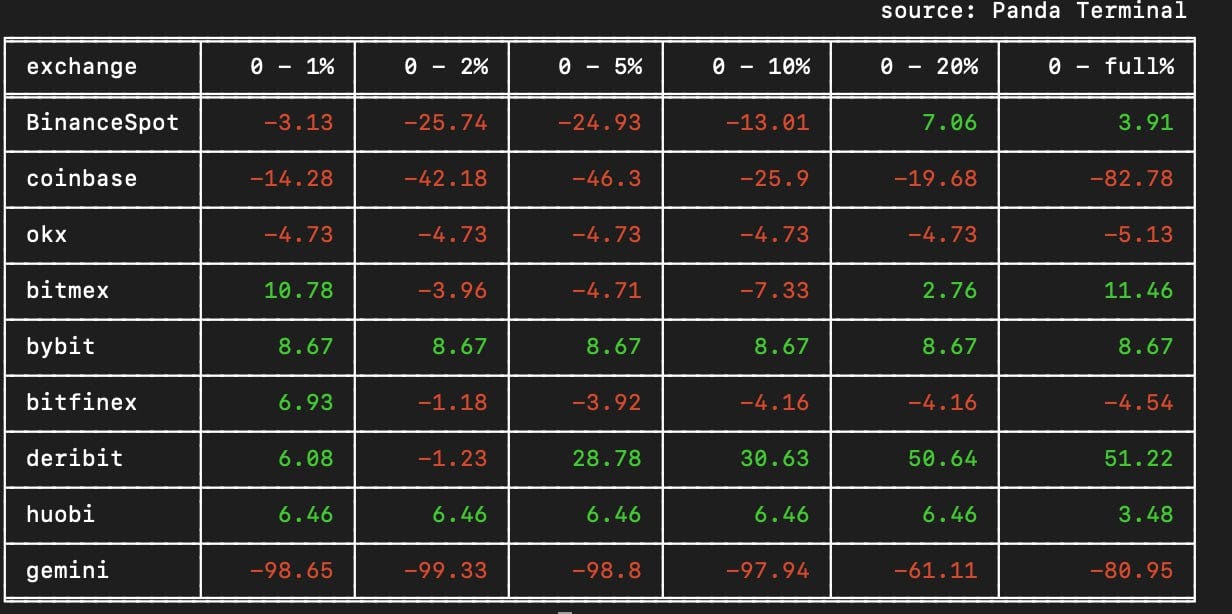
Feels like retail is buying up the uptick in ETF flows being absorbed from Grayscale while the books don’t show much difference.
To sum it up here, the weekend doesn’t seem poised for sustainable upside moves.
OK, that’s enough here, I said it would be short and here I am 800 words in. Man I suck at that… I’m definitely the reason why meetings never end on time at Jlabs Digital.
Now, for what you’ve probably stuck around to read, Mr. JJ himself!
-Ben
Boredom Begets Opportunity
81% in a matter of months.
That’s how Bitcoin charged into the new year and the Bitcoin spot ETF.
In the weeks since, price action has faded and settled into a compressed range. This range currently sits between $38,200 (January 23rd low) to $44,000 (January 30th high) with back and forth liquidity sweeps in the interim.
Despite this back and forth price action, the options market is showing little signs of interest in taking any sort of directional bias into February.
It speaks to a disinterest in the market.
We see this disinterest visualized when we observe the Bitcoin Implied Volatility Index. The index measures the constant, 30-day expected volatility of the Bitcoin market based on options and helps us to understand how much of a premium is being placed on options contracts.
As we see below, it has fallen from a score of over 77 on January 8th, to now below 50, which places it back into the range it was trading prior to Bitcoin’s leg up beginning in October when the FOMO demand for out-of-the-money call options into the ETF launch began.
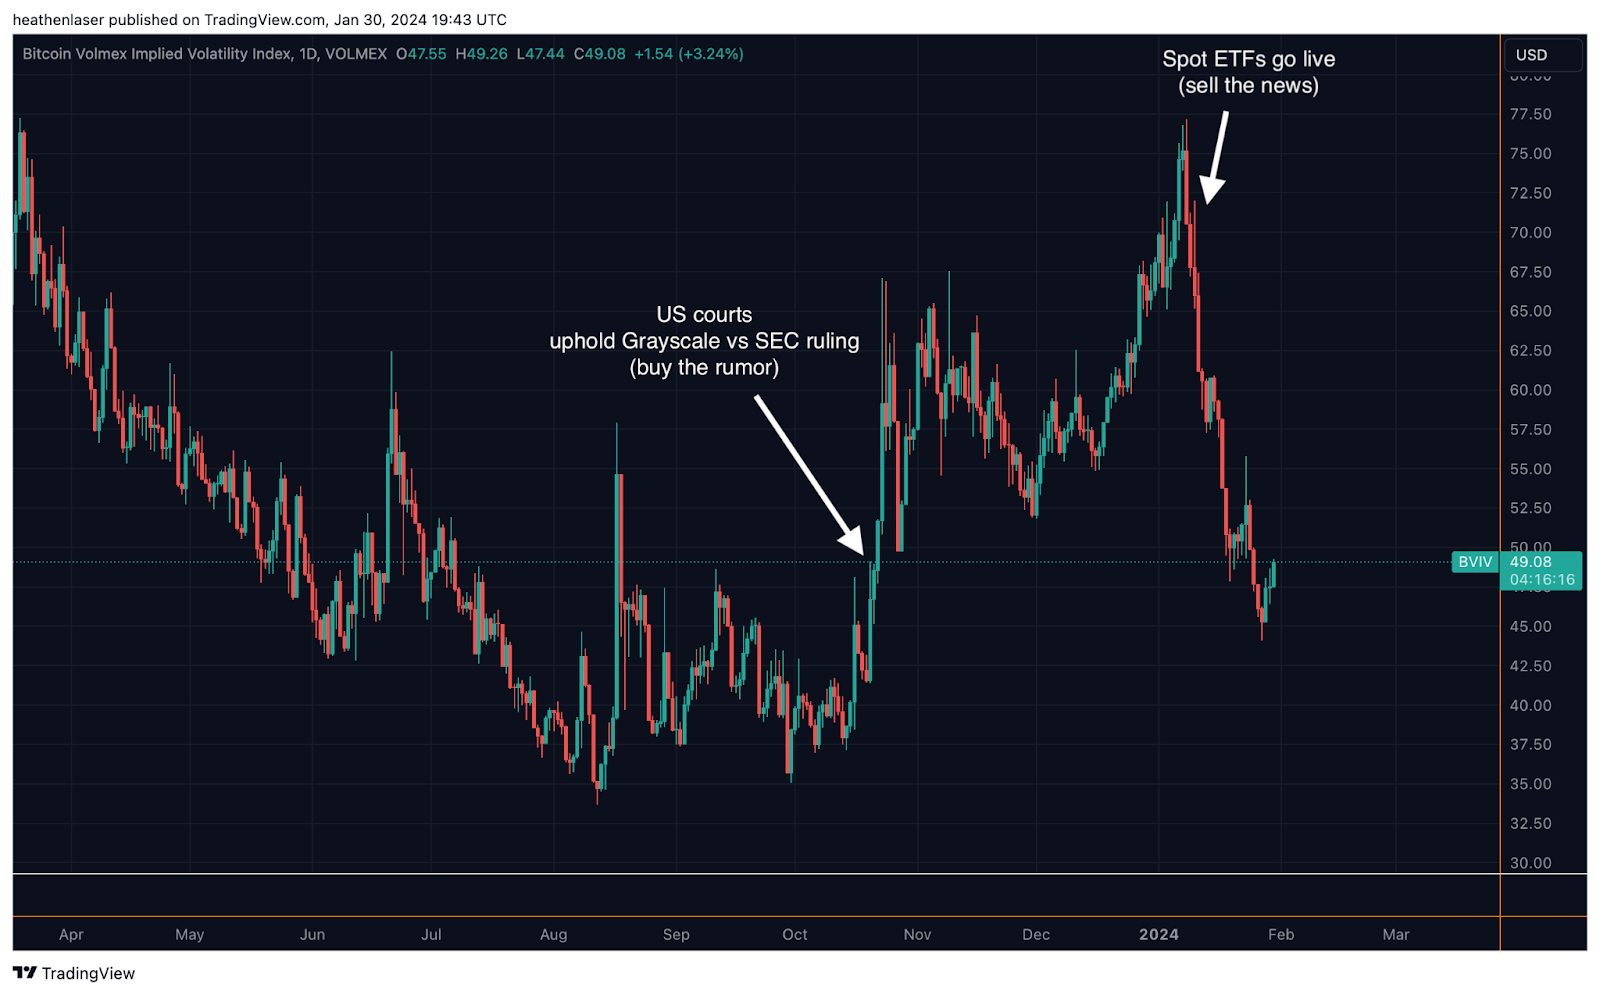
This drop in Implied Volatility is a reflection of the options market as a whole taking profit on the ETF news event it front ran in Q4 2023 and having little interest to hop back into directional positions as we enter February.
We even see this disinterest show up in the amount of options contracts being traded.
In the chart below, we can see open interest levels on Deribit have fallen nearly 33% following the January 26 monthly expiration from nearly 300,000 BTC notional earlier this month, to just over 200,000 BTC notional worth at present.
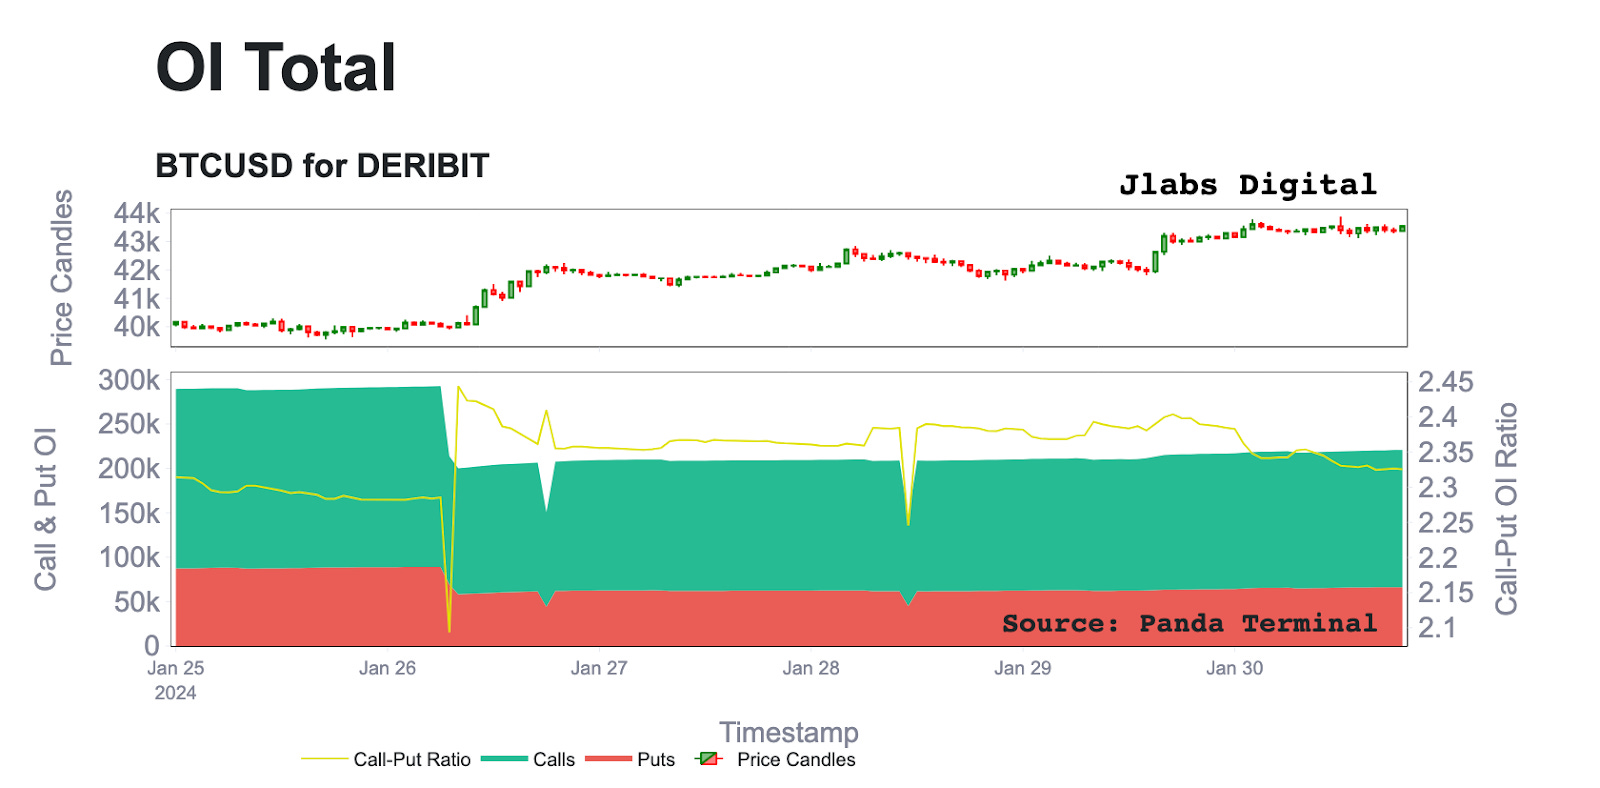
This decline in open interest speaks again to this disinterest. And it’s clear we don’t see pre-ETF actors eager to jump back into the market.
Looking forward, we see that the March 29th 2024 end of Q1 options expiration date is where the largest amount of open options interest now rests with around 72,500 BTC worth of notional value, 22,000 BTC puts and 50,000 BTC calls. I highlighted this contract with the red box below.
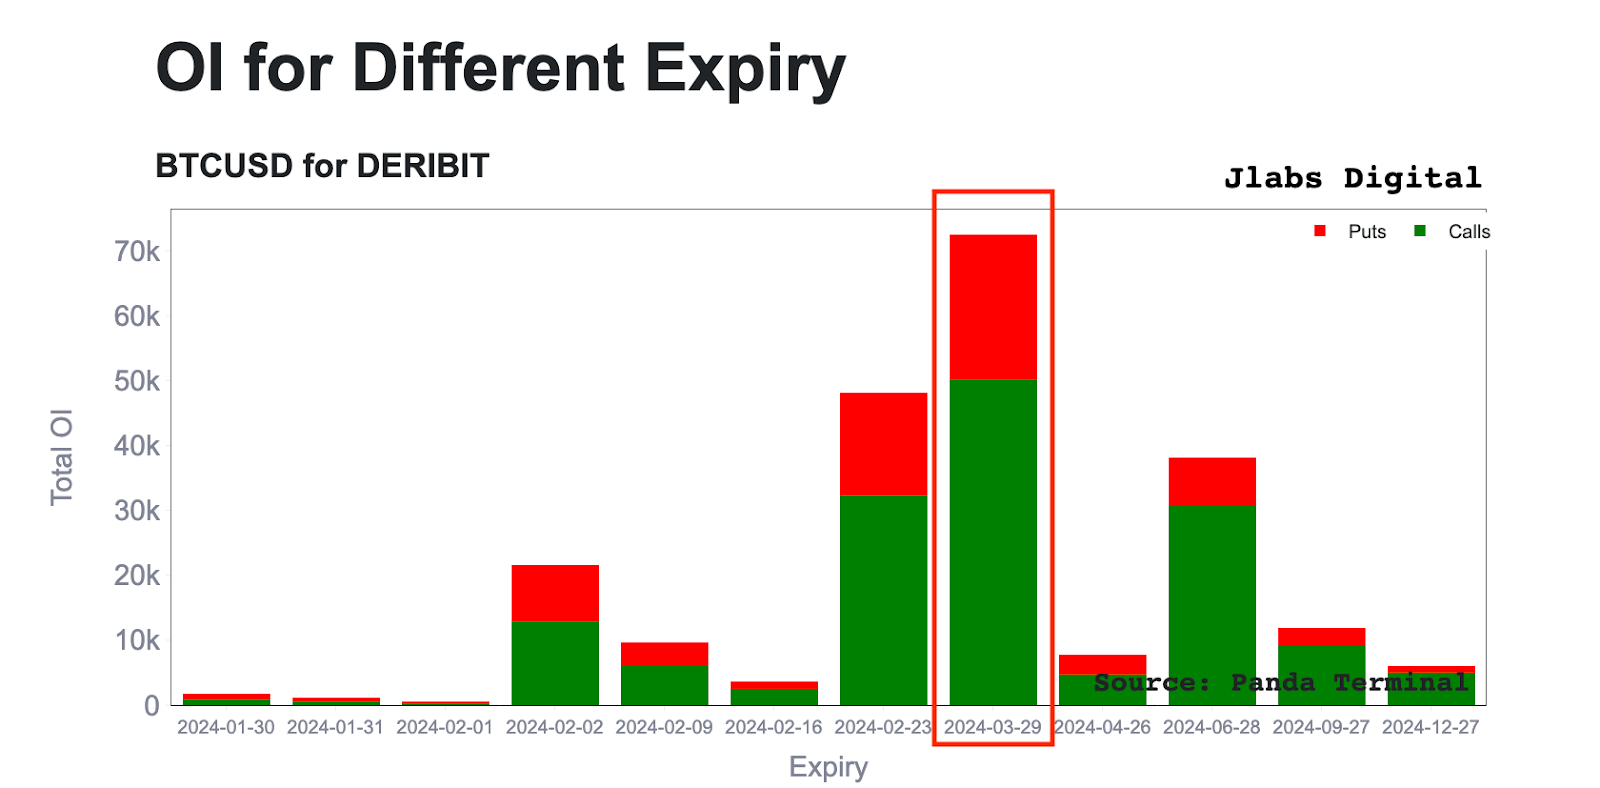
This expiration becomes one to watch in the coming weeks. Next week, I’ll be sure to dive further into this contract to help us better understand what it might have in store for us as we get closer.
See you next week,
JJ
P.S. - Ben here again… Here is that bubble filled chart below. Don’t try to read too much into it as it’s pretty nuanced.
Also, below it are the week’s xChanging Good recordings for the week. Have a great weekend and let’s get back at it next week, shall we?
January 30…
February 1…


