Bitcoin’s Last Hope for 2023
Notes From the Lab: Don’t Get in King Dollar’s Way


Down three runs, bottom of the 9th, with bases loaded and a full count.
As the pitcher begins his windup, the batter’s eyes widen.
He’s studied the pitcher’s release and knows exactly what’s coming next.
The fat pitch he’s been waiting for, a juicy fastball straight down the middle that he can time perfectly and crank out of the park for the game-winning grand slam.
Before he even begins his swing, he sees a vision of what will happen next…
He’ll make contact, the ball will launch into the stratosphere, the crowd will go wild… then he and his teammates will celebrate at home plate and on through the night.
He’s about to make a play that will live on forever as one of the most clutch plays in baseball his–
“STRIKE!”
His fleeting moment of mental bliss is abruptly interrupted by the umpire shouting into his ear.
He missed. Game over. His deflated teammates shuffle off the field.
What happened?
Well, the pitch he thought was a fastball turned out to be a well-disguised change-up. He started his swing a fraction of a second too early, making contact with nothing other than the night air.
He’d been outfoxed by the more experienced, savvier pitcher who knew exactly what throw he was expecting.
If attempting to time your Bitcoin (BTC) trades has felt a lot like that recently, you’re not alone.
The increased presence of stealthy institutional counterparties and their advanced algorithms has made trying to time perfect long and short entries harder than hitting a homer off Greg Maddux in his prime.
The result? A never-ending chopfest for us retail traders and a whole lot of disappointment.
Welcome to the big leagues, kid.
Today, let’s dive into some of the technical signals their current wind-up is sending, and see if we can’t discern what trajectory Bitcoin is most likely to take as we head into Q4.
Bitcoin on Borrowed Time
First up is the obvious: Last month, the dreaded death cross painted Bitcoin’s front door again.
The death cross refers to the rare instance when the 50-day moving average (MA) falls below the 200-day MA. It is a sign of technical exhaustion that leads to substantially lower prices over the following months.
For reference, here’s what happened the last two times BTC experienced a death cross:
- The first came in June 2021, when Bitcoin was near $43,000. By the end of July, it had fallen over 35% to near $28,000.
- The next came in January 2022, when Bitcoin was trading around $48,000. By the end of that month, it fell about 35% to under $32,000 before ending the year down around $16,000.
Both those previous instances were vicious signs of the end, and our current structure looks frighteningly similar, as you can see in the chart below. (We’ll explain the purple line at the bottom and the arrows there in a bit.)
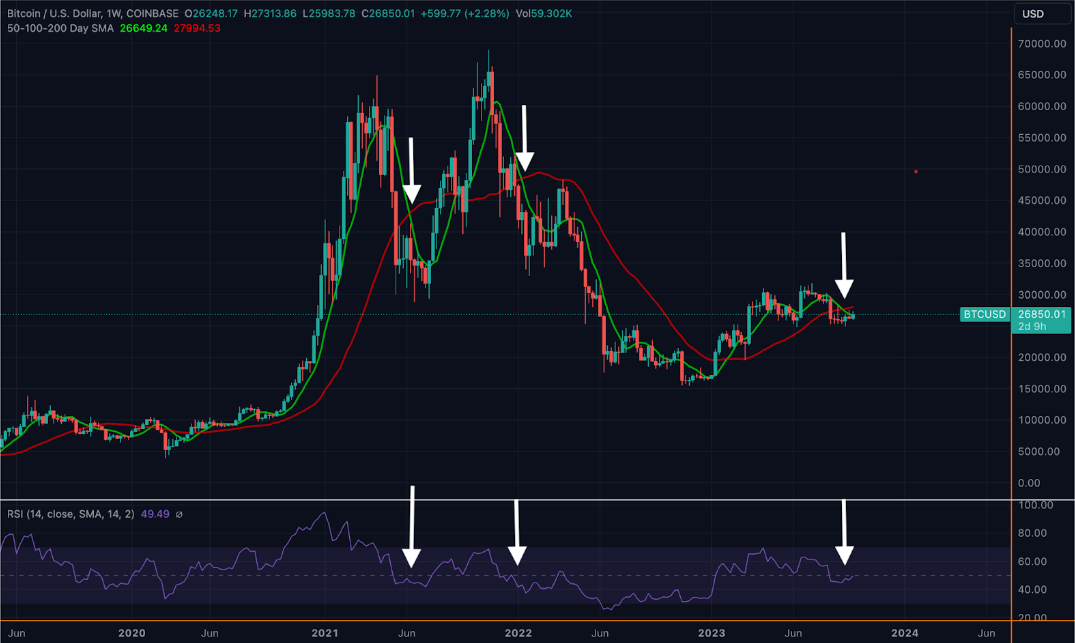
If Bitcoin wants to have any hope of dodging a similar fate, and avoid crashing to sub-$20,000 lows this fall, it must reclaim lost territory quickly this October.
Fortunately, such a move is within striking distance, at least at time of writing.
Currently, Bitcoin is encroaching on two key lines of resistance into the Q3 close.
They are the 50-mark on the weekly relative strength indicator (RSI) chart, which measures an asset’s momentum, and the “9, close, 0, SMA, 5,” which represents a blend of moving averages that help us determine the overall market trend.
As we see on the chart below, Bitcoin carried both the “9, close, 0, SMA, 5” trend line (blue line) and >50-RSI weekly mark (purple line) throughout its 2023 uptrend, before losing them both just prior to August’s brutal crash from $29,000 to below $25,000.
Each time it has reconquered them this year, it led to BTC’s three most explosive moves to the upside.
The first came in January when it jumped from sub-$17,000 to over $23,000 in one week.
The second was in March when the aftermath of Silicon Valley Bank’s crash teleported price from around $19,000 to over $28,000 in a week.
And the third came following BlackRock’s announcement of its spot ETF filing, which sent it from near $24,500 to over $31,000 in about a week.
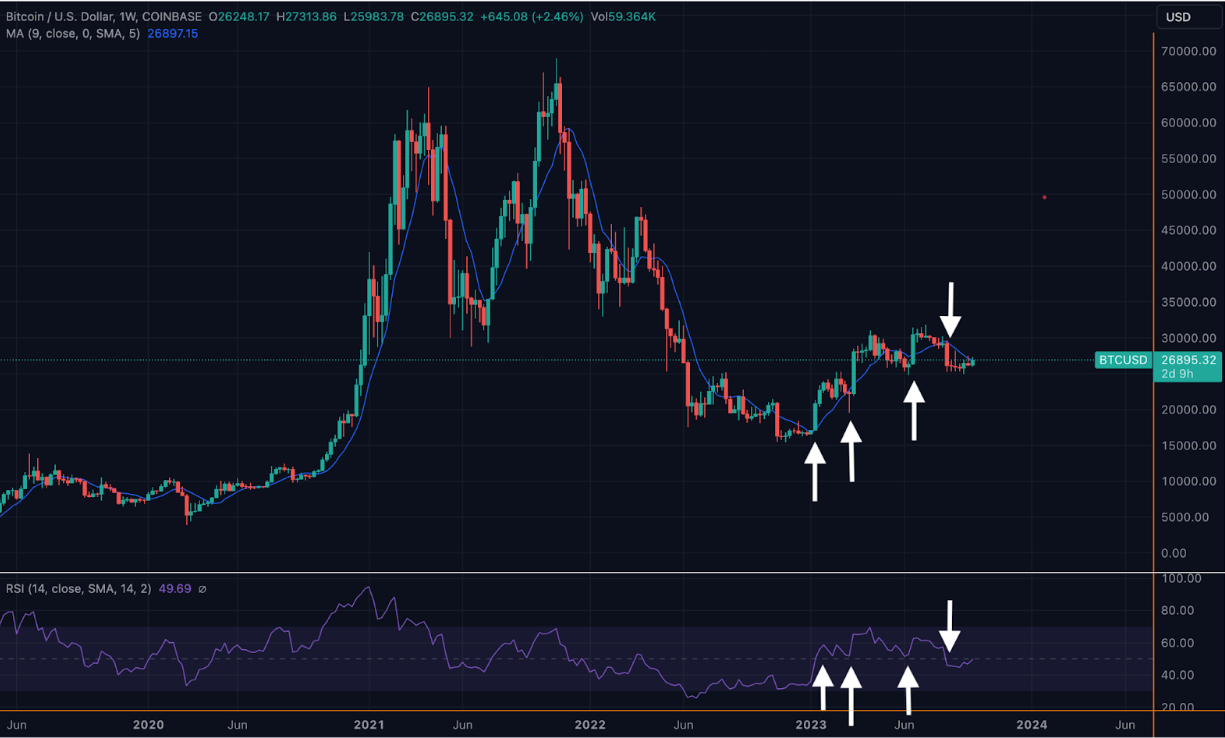
If (and this is a major if) Bitcoin can take this lost ground in early October, expect a similar rapid move to the upside, as short interest that has piled in since BTC failed at $30,000 will get brutally squeezed out of their positions.
But also keep in mind that such a development would likely require a catalyst.
A catalyst which doesn’t seem to be anywhere in sight now that the SEC has formally delayed ruling on nearly all spot BTC ETF filings until Q1 2024.
And though there is still the looming possibility of the agency admitting defeat and allowing Grayscale’s spot ETF to go live on October 13, the most likely outcome, according to experts, is that it will fight the ruling or find more ways to delay there as well.
That leaves only one possibility to save Bitcoin from a Q4 demise, which would be the fall of its arch nemesis, King Dollar (DXY).
Return of the King
Since I last wrote you back in early August, the doomsday scenario I outlined for King Dollar has come to fruition:
Should DXY break above 50-RSI and its 200-day SMA, it will be lights out for Bitcoin and crypto at large as I’d expect volatility to send us spiraling.
My downside areas of interest for Bitcoin become $24,600 (June low), $19,300 (March low), $15,300 (post-FTX low), and oblivion.
DXY did in fact break above those resistance levels. And though so far BTC has only managed to tag downside target No. 1, that bearish activity may have only been a precursor for what the king has in store for us BTC faithful as we near the end of 2023.
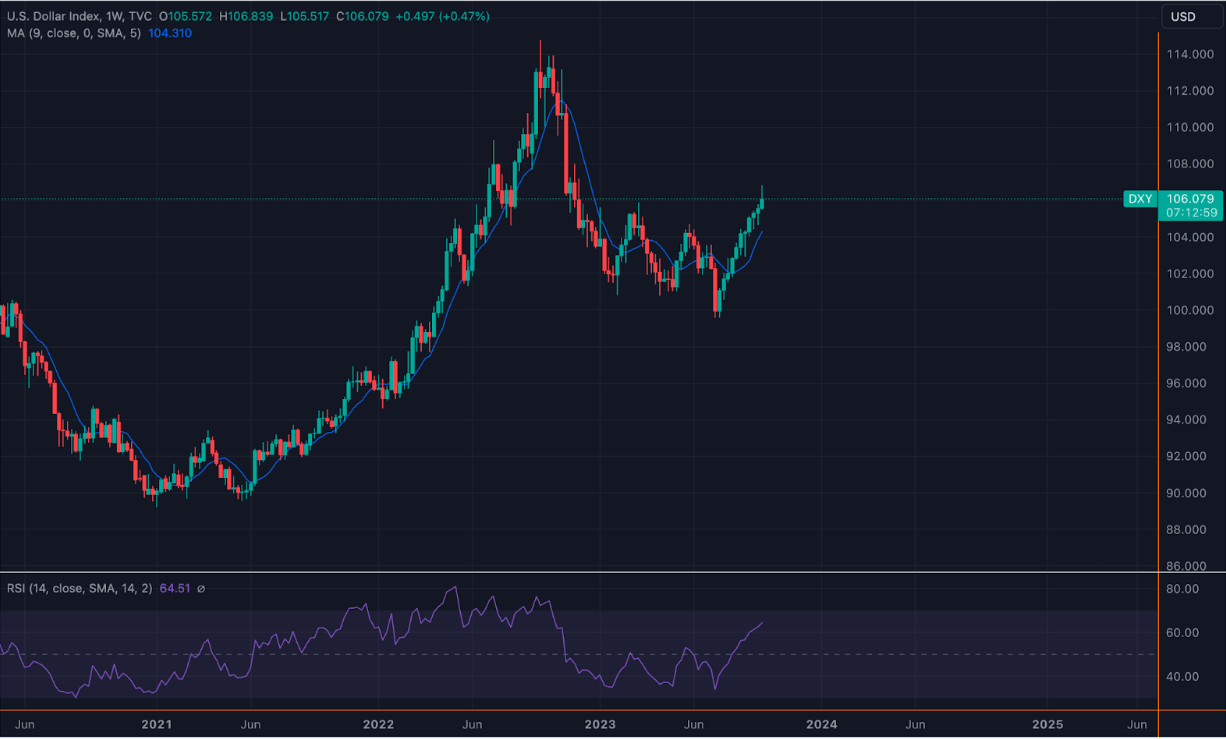
As we see below, DXY reconquered all major moving averages and RSI resistance levels on major time frames, which sent it on a rampage from August through October…
…A rampage which has not shown even the slightest hint of slowing down. Every dip has been nothing more than a technical reset, allowing it to continue higher.
In contrast to BTC, DXY hasn’t even come close to losing the 50-RSI mark, nor its “9, close, 0, SMA, 5” trend line on the weekly chart, since breaking above both on August 1.
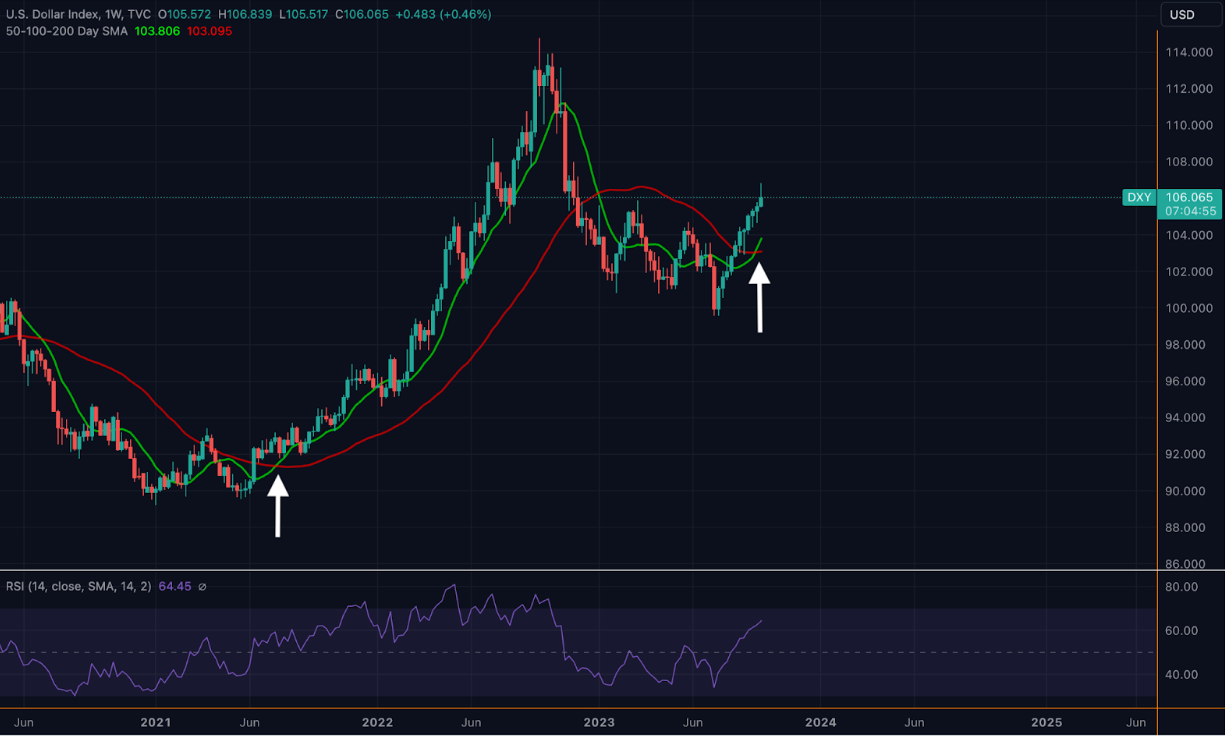
To add insult to injury and make BTC’s Q4 prospects even worse, DXY has recently experienced the inverse of BTC’s death cross, registering a golden cross (when the 200-day MA falls below the 50-day MA) on its weekly chart for the first time since June 2021.
As shown below, the last time this pattern appeared, DXY went from 91 to over 114 in about 15 months, so the odds of any downtrend beginning from here are extremely unlikely.
Whether we like it or not, Bitcoin cannot thrive if the dollar’s strength persists at these levels. It too is beholden to the king and to the liquidity Fed Chair Jerome Powell gives out as pittance to global markets.
Thanks to the DXY chart above, Powell’s latest FOMC speech, and recent inflation readings, we have little reason to believe that this uptrend will end in any meaningful way anytime soon.
By all measures, the powers that be appear content to let the king slaughter his subjects until something meaningful in the legacy financial system breaks. And unfortunately for us, that may just require Bitcoin revisiting its 2022 lows prior to them sending liquidity to the rescue.
It is not a scenario we hope to see, but one that is becoming increasingly likely with each passing day that DXY moves higher, while BTC consolidates below key resistance levels.
All this to say, throughout the next month be mindful of how price reacts near these resistance levels. And keep your charts tuned into DXY, as it will almost certainly tell us where BTC is heading next.
The only thing I feel certain of is come the end of this year, Bitcoin will no longer be chopping around its same old range of $24,000–$30,000.
Until next time, trade safely, plan for the worst, pray for the best, and keep your head on a swivel.
Your friend,