Bitcoin's Current Crisis
What you need to know about BTC's liquidity crisis

You’ve probably seen a chart or analyst mention the fact there is a liquidity crisis happening in bitcoin.
If you’re not aware of what this means, it’s a comment targeted at centralized exchange holdings taking a nose dive in 2020.
Meaning bitcoin were, and still are, leaving exchanges by the bucket load. In effect, this means the amount of bitcoin available for willing buyers are drying up. Which in turn creates scarcity, demand pressure… And the reason many of us are here, higher prices.
Today, I’d like to drop some charts in front of you as you sip away at this morning’s espresso that show what this ‘liquidity crisis’ is all about and what it means for the upcoming boom and bust cycle.
Where’d It Go?
Here’s the chart that highlights the liquidity crisis phenomenon. Focus on the yellow line, it’s taking a nose dive, showing us the total balance of BTC on exchanges have dropped from about 3 million to just a hair over 2.3 million from March 2020 to now.
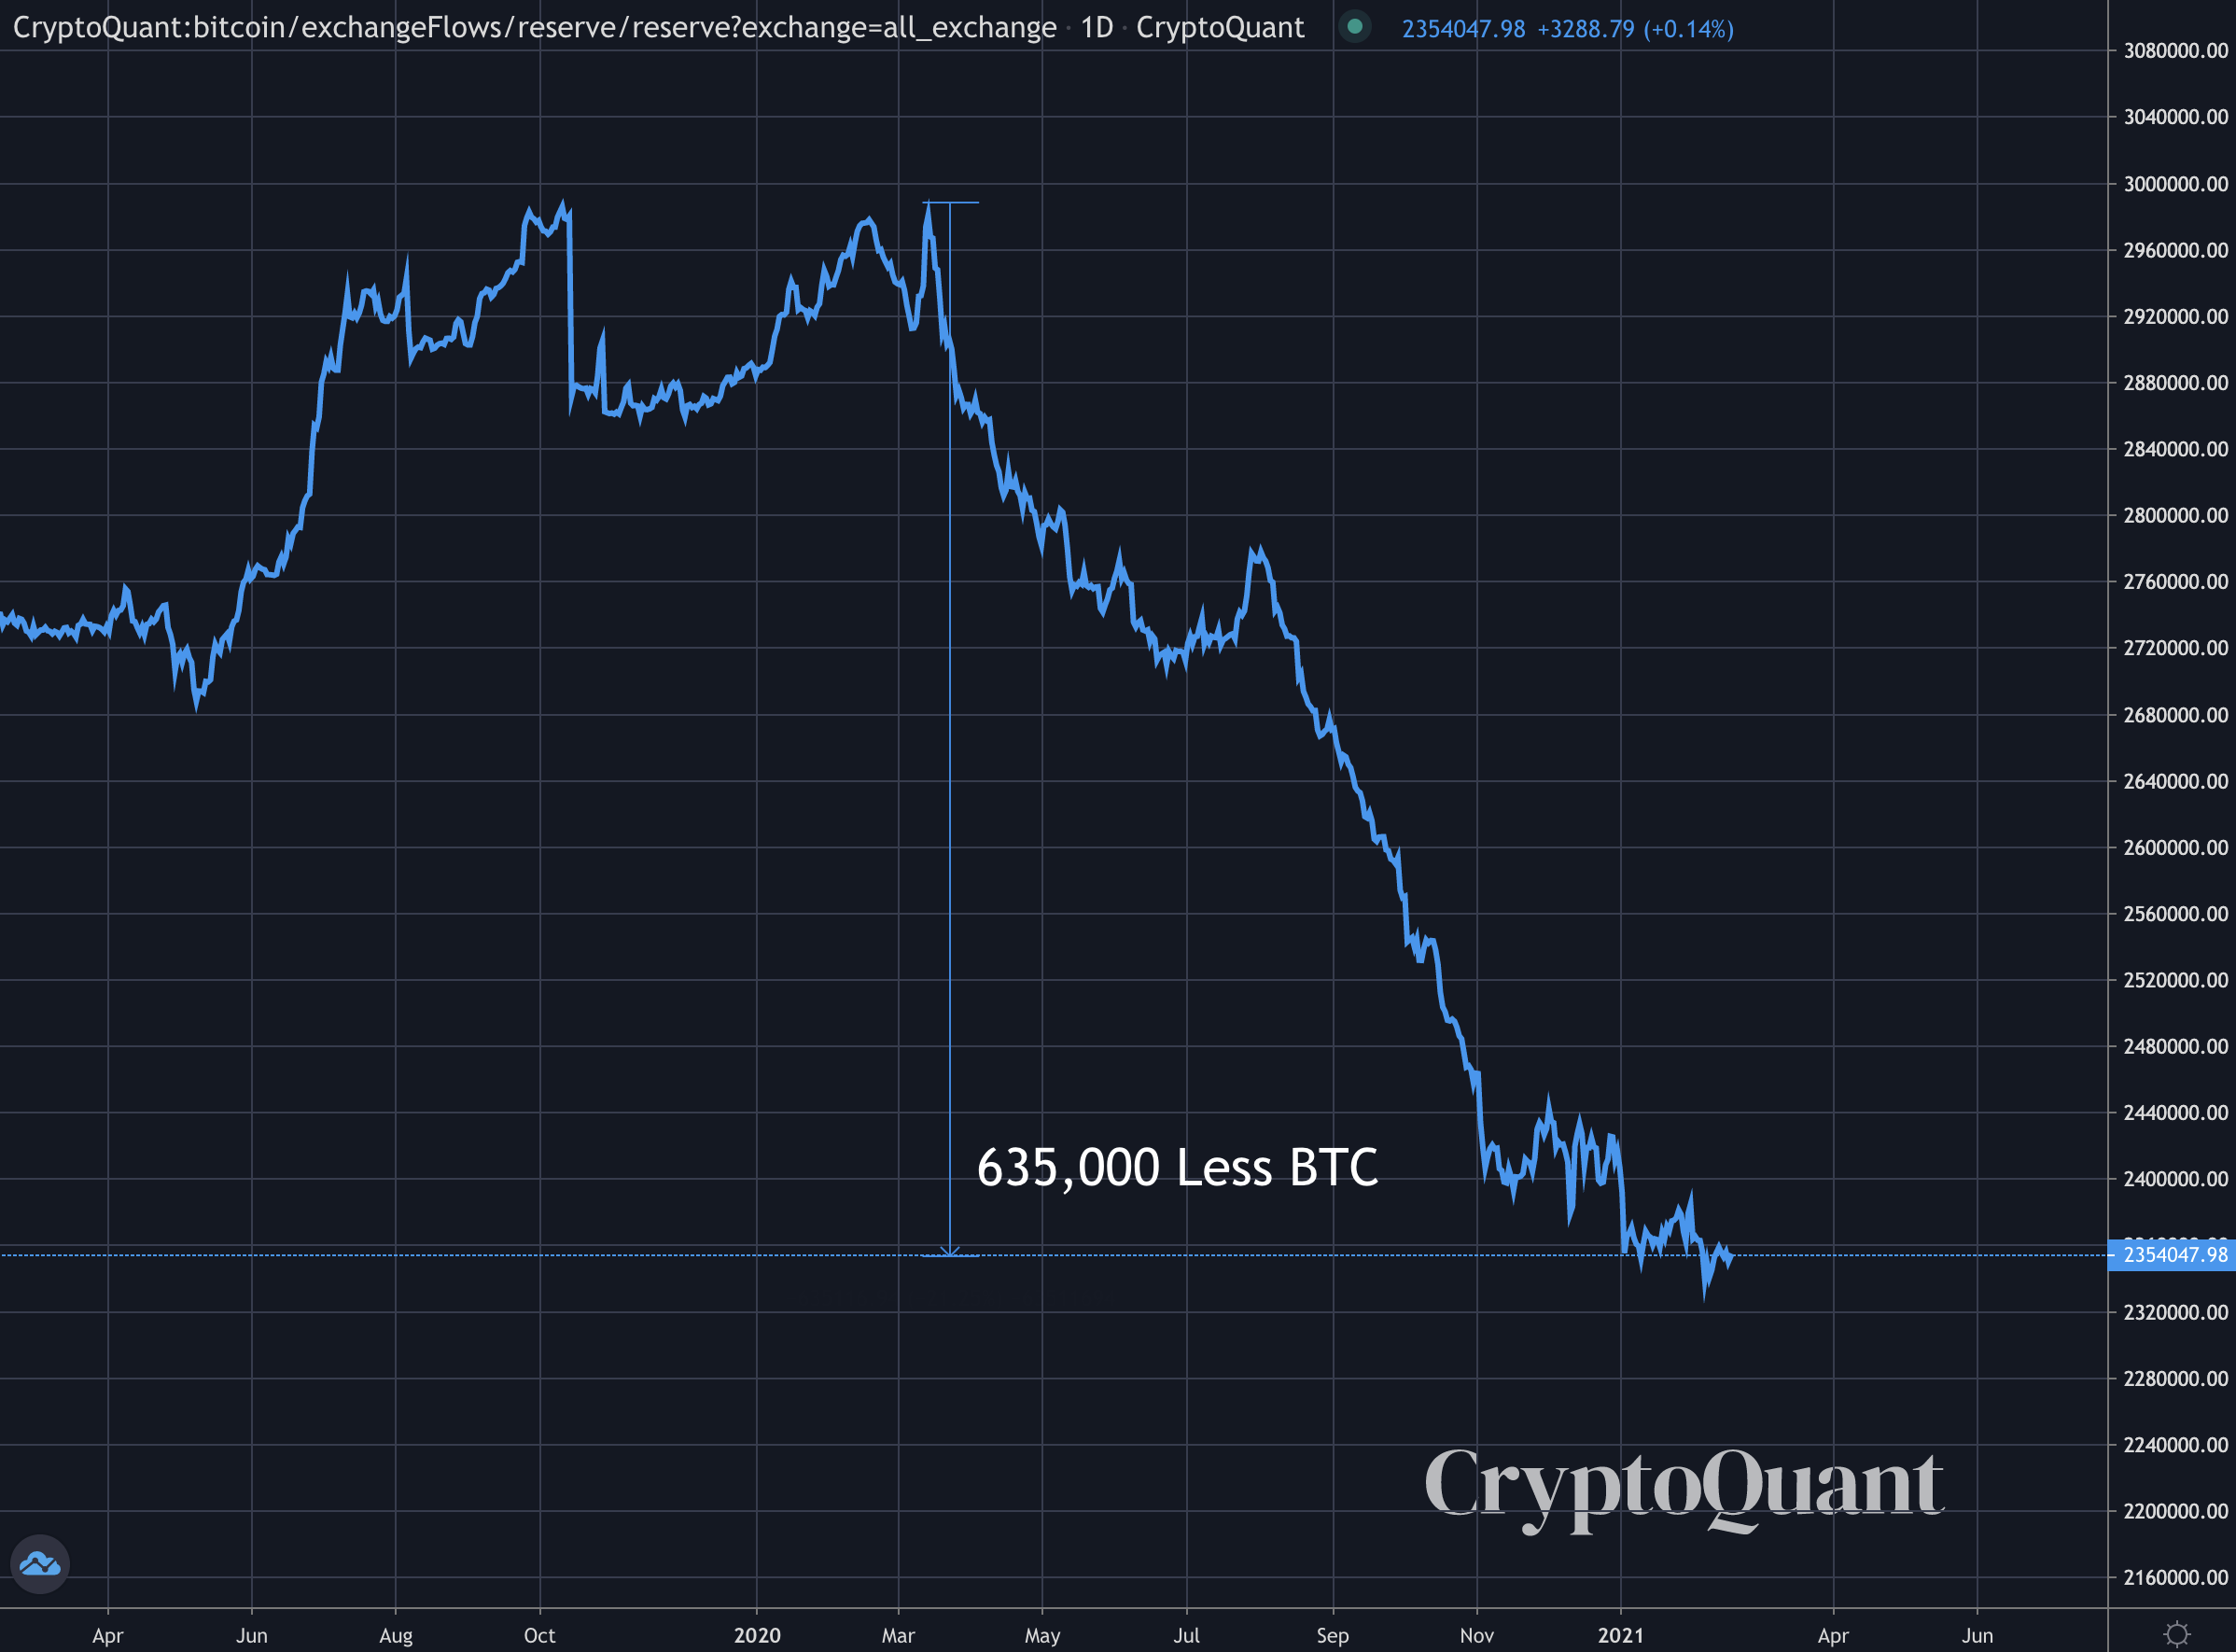
That’s about 23% less BTC floating around on the supply side of the market than there were about a year ago.
For any investor sitting on the sidelines, a glance at this stat screams scarcity.
But is this really a clear picture of what’s going on? Didn’t this thing called DeFi pop up and create wrapped BTC on the Ethereum network? Is that where all the BTC went?
To take a look, here’s a chart from Dune Analytics showing the supply of BTC on Ethereum.
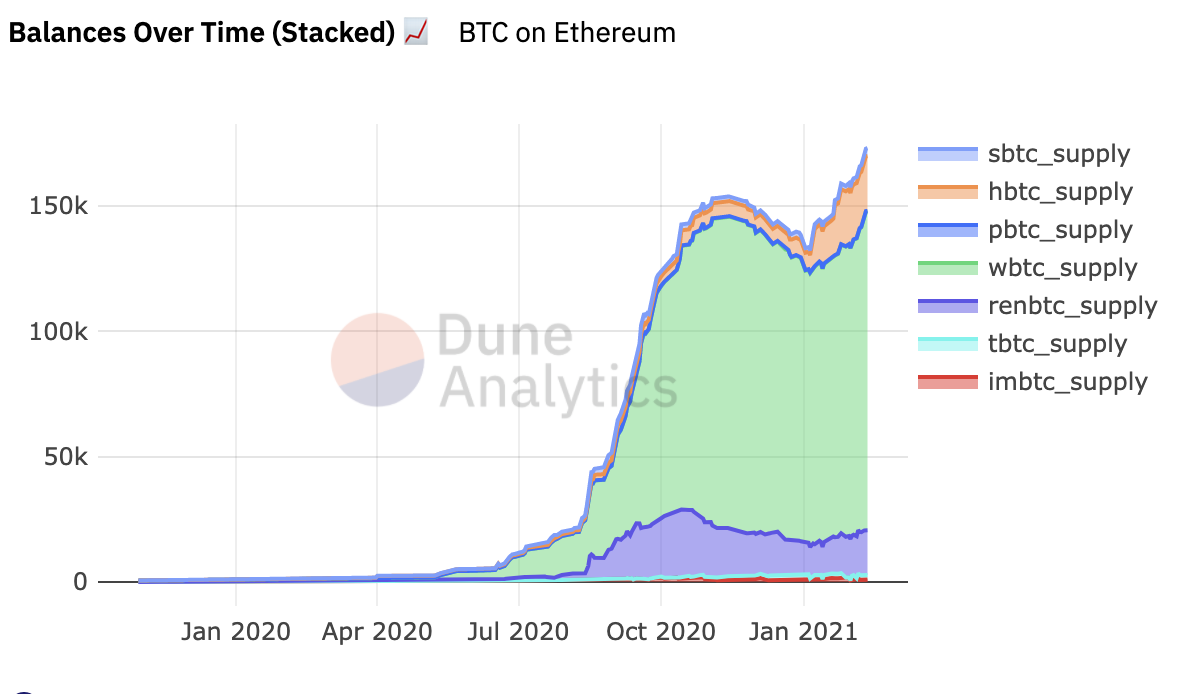
That’s a bit over 160k BTC sitting on the Ethereum network… we’re about 475k BTC short of where it all went. Plus, that really only accounts for the drop in exchange supply from August to November.
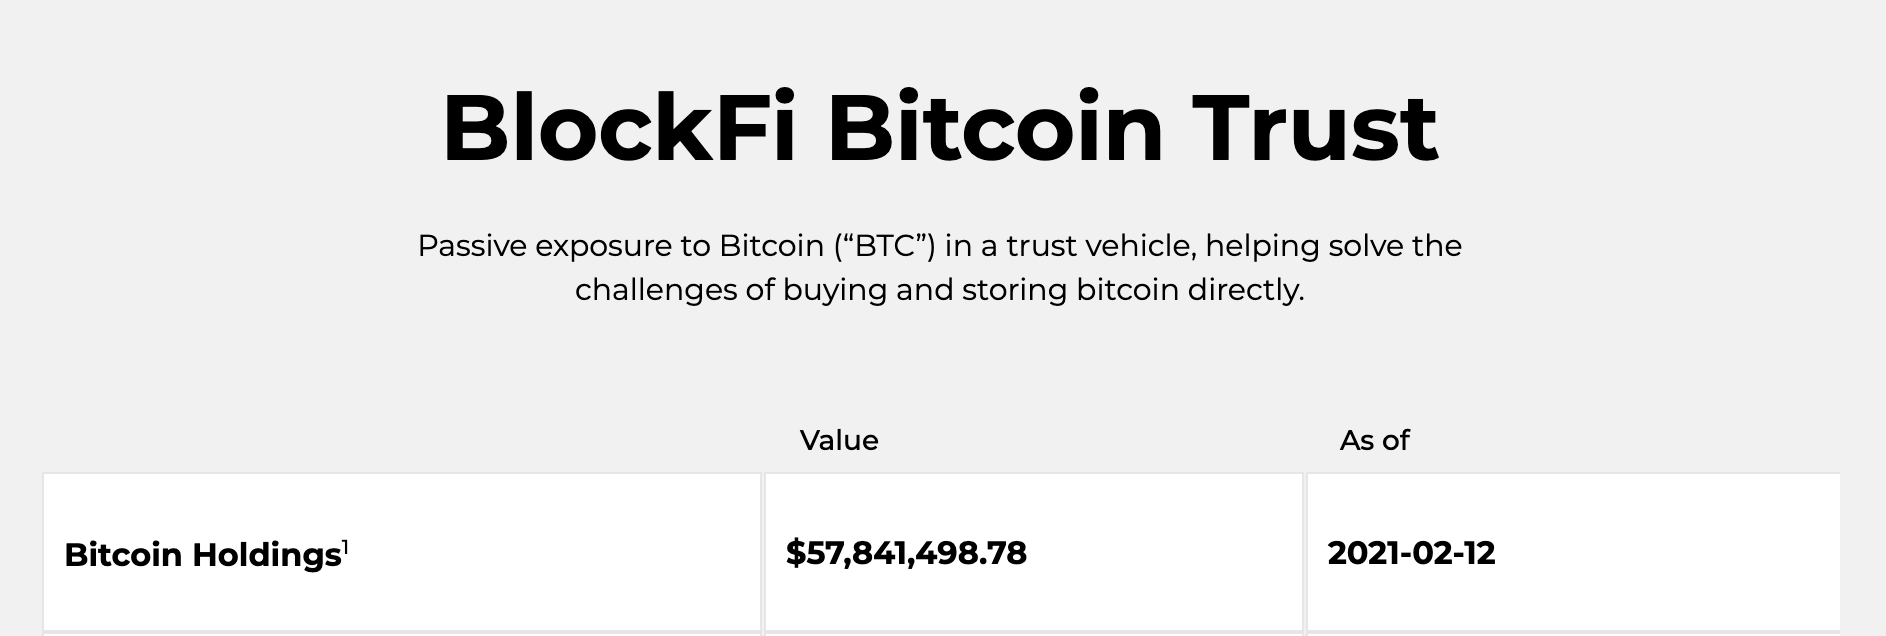
Another thought is BlockFi and Celsius. However, deciding which wallet is held by these entities is a bit of an educated guess, so rather than making an assumption let’s just assume “some” bitcoin is held in these vehicles.
Honestly, I don’t believe this amount is as big as many believe. Here is BlockFi’s recent Bitcoin Trust product and its current AUM of $57 million or nearly 1,200 BTC. Let’s keep these entities out of our back of the envelope math for the time being.
The other place we can look is the ‘Prince of Pump’, Grayscale.
Here’s a quick look at their holdings from early June 2020 to now. That’s about 300k bitcoin. Wow.
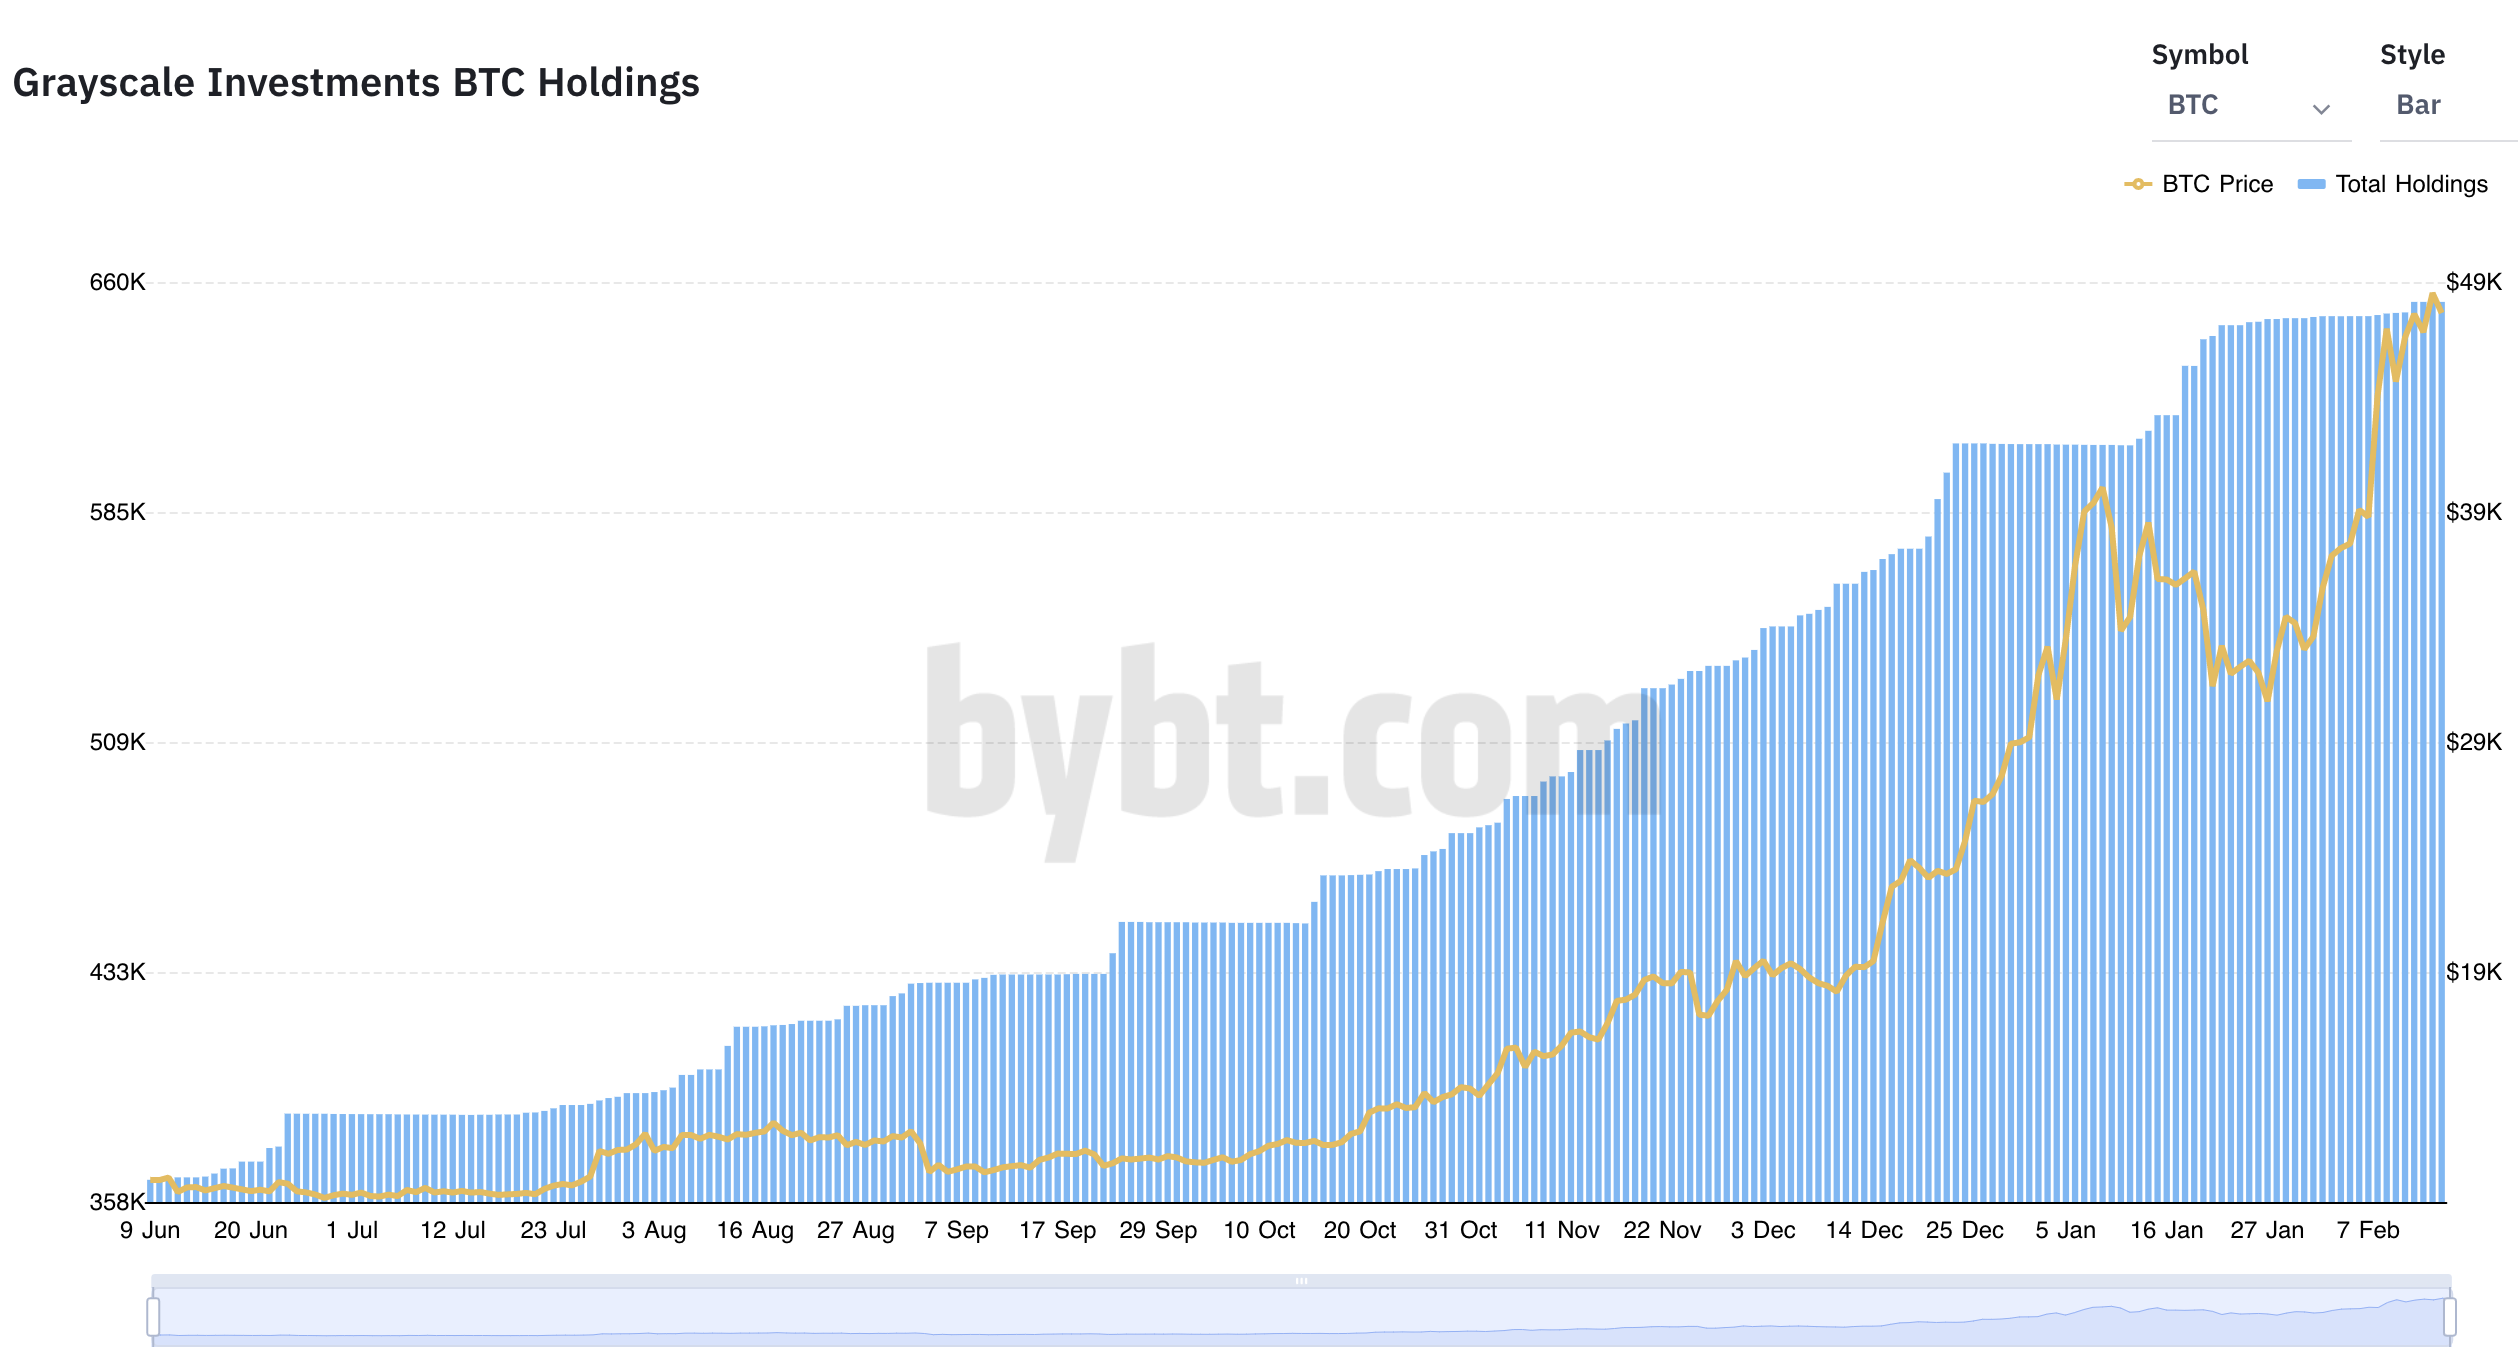
Still, that leaves us about 175k BTC short.
To figure out approximately how much BTC went into Grayscale from Feb 2020 to June 2020 I went ahead and used my ultra precise method of drawing red lines with my computer’s default photo editor.
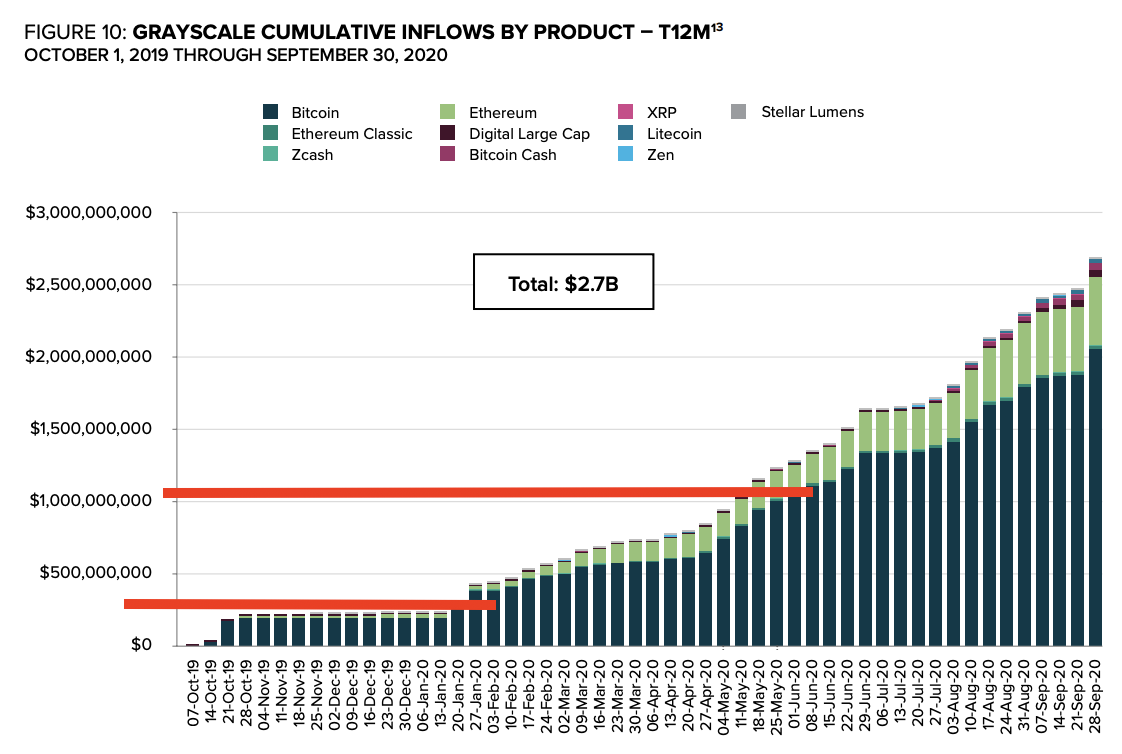
Let’s call it $750 million of inflow into Grayscale Bitcoin Trust from Feb 2020 to June 2020 - where the bybt.com chart left us hanging. Using monthly closing prices the average price of BTC was $8,250. Meaning approximately 90k BTC flowed into the fund during this time span.
This leaves us with about 85k of BTC that’s unaccounted for.
Tesla purchased $1.5 billion of bitcoin in January. Assuming the purchase averaged out around $35k, that’s over 42k BTC off the table.
MicroStrategy lays claim to 71k BTC.
Ruffer Investment Co. snagged 45k in November 2020.
That puts us at -73k on our back of the envelope math problem… But wait…
There are several other entities that got their share as well: Square (4.7k), Bitwise (11.4k), Stone Ridge Holdings (10.9k).
Now we’re way into the red… -100k BTC. How is that possible?
Well, for a more in-depth analysis we need to figure out how many BTC from miners went to the exchange and also look at each entity individually and ensure the BTC actually left the exchange. Many exchanges double as custodians. This is a bit outside the scope of a daily newsletter, and for our purposes we can see clearly three distinct demographics are removing liquidity away from exchanges.
Grayscale, Corporations and DeFi.
What does this mean?
It means bitcoin is in fact becoming scarce. If this continues, a liquidity crisis will transpire pushing prices considerably higher.
Grayscale, as I hit on within the Grayscale Effect piece, is a one way vehicle where bitcoin enters the Trust and doesn’t come out.
Corporations like MicroStrategy are using bitcoin to fight the effect of record money supply growth via government currencies. Other have and will continue to follow in their footsteps. This is not a month to month type of decision that takes place in a C-suite, it’s on the timeline of years. Inflation is coming, it’s just a matter of when.
Then there’s DeFi. Which to me is the most interesting of the three because BTC is predominately used in DeFi to earn yield. Not to trade. Meaning similar to Grayscale, this is a sink hole. Looking at the chart above that shows the amount of bitcoin transacting on Ethereum, you can see the growth is predominately one way, up.
And with more platforms opening up like Polkadot, Cosmos and Solana, the potential for more bitcoin moving across more platforms into DeFi protocols is even greater.
These three different sectors are absorbing nearly all the bitcoin moving off exchanges right now.
Which tells us two more things. Bitcoin being used as a hedge against the dollar aka “Gold 2.0” and it’s being used as collateral to earn yield. These are bitcoin’s strongest use cases right now. The Gold 2.0 narrative is openly being discussed and embraced. The second use case I believe will gain momentum in the second half of the bull run.
Why?
It’s important to understand how investors can use BTC as collateral. Investors don’t need to sell BTC to tap its value. They can now do it through collateralized loans. In doing so, investors can potentially side step capital gains tax on their bitcoin while enjoying its price appreciation. And WHEN bitcoin is six figures it begs the question…
Why sell?
This question is one I’m pondering at the moment as I think of the possible scenarios in which this boom and bust cycle play out.
It’s an evolving thought. One that I won’t have the answer to until it begins to play out.
But here me out for a moment on something..
What other asset allows for nearly instant liquidity without needing a bank?
If I’m MicroStrategy and I need a business loan, I don’t need a bank. I can literally write the loan to myself using bitcoin.
This creates an entirely different class of investors who are not as speculative as in cycles prior.
Which brings us to the thought of the day… If there’s a liquidity crisis, who’s selling?
Your pulse on crypto,
B
p.s. - Market Update: Bitcoin chewed through the $50k sell wall, attacking $51k now (2:40 UTC). Funding rates look great. If we break $50k with conviction, expect bitcoin to suck up liquidity from the rest of crypto. Many alts are likely to go red until bitcoin holds a new price level with confidence.
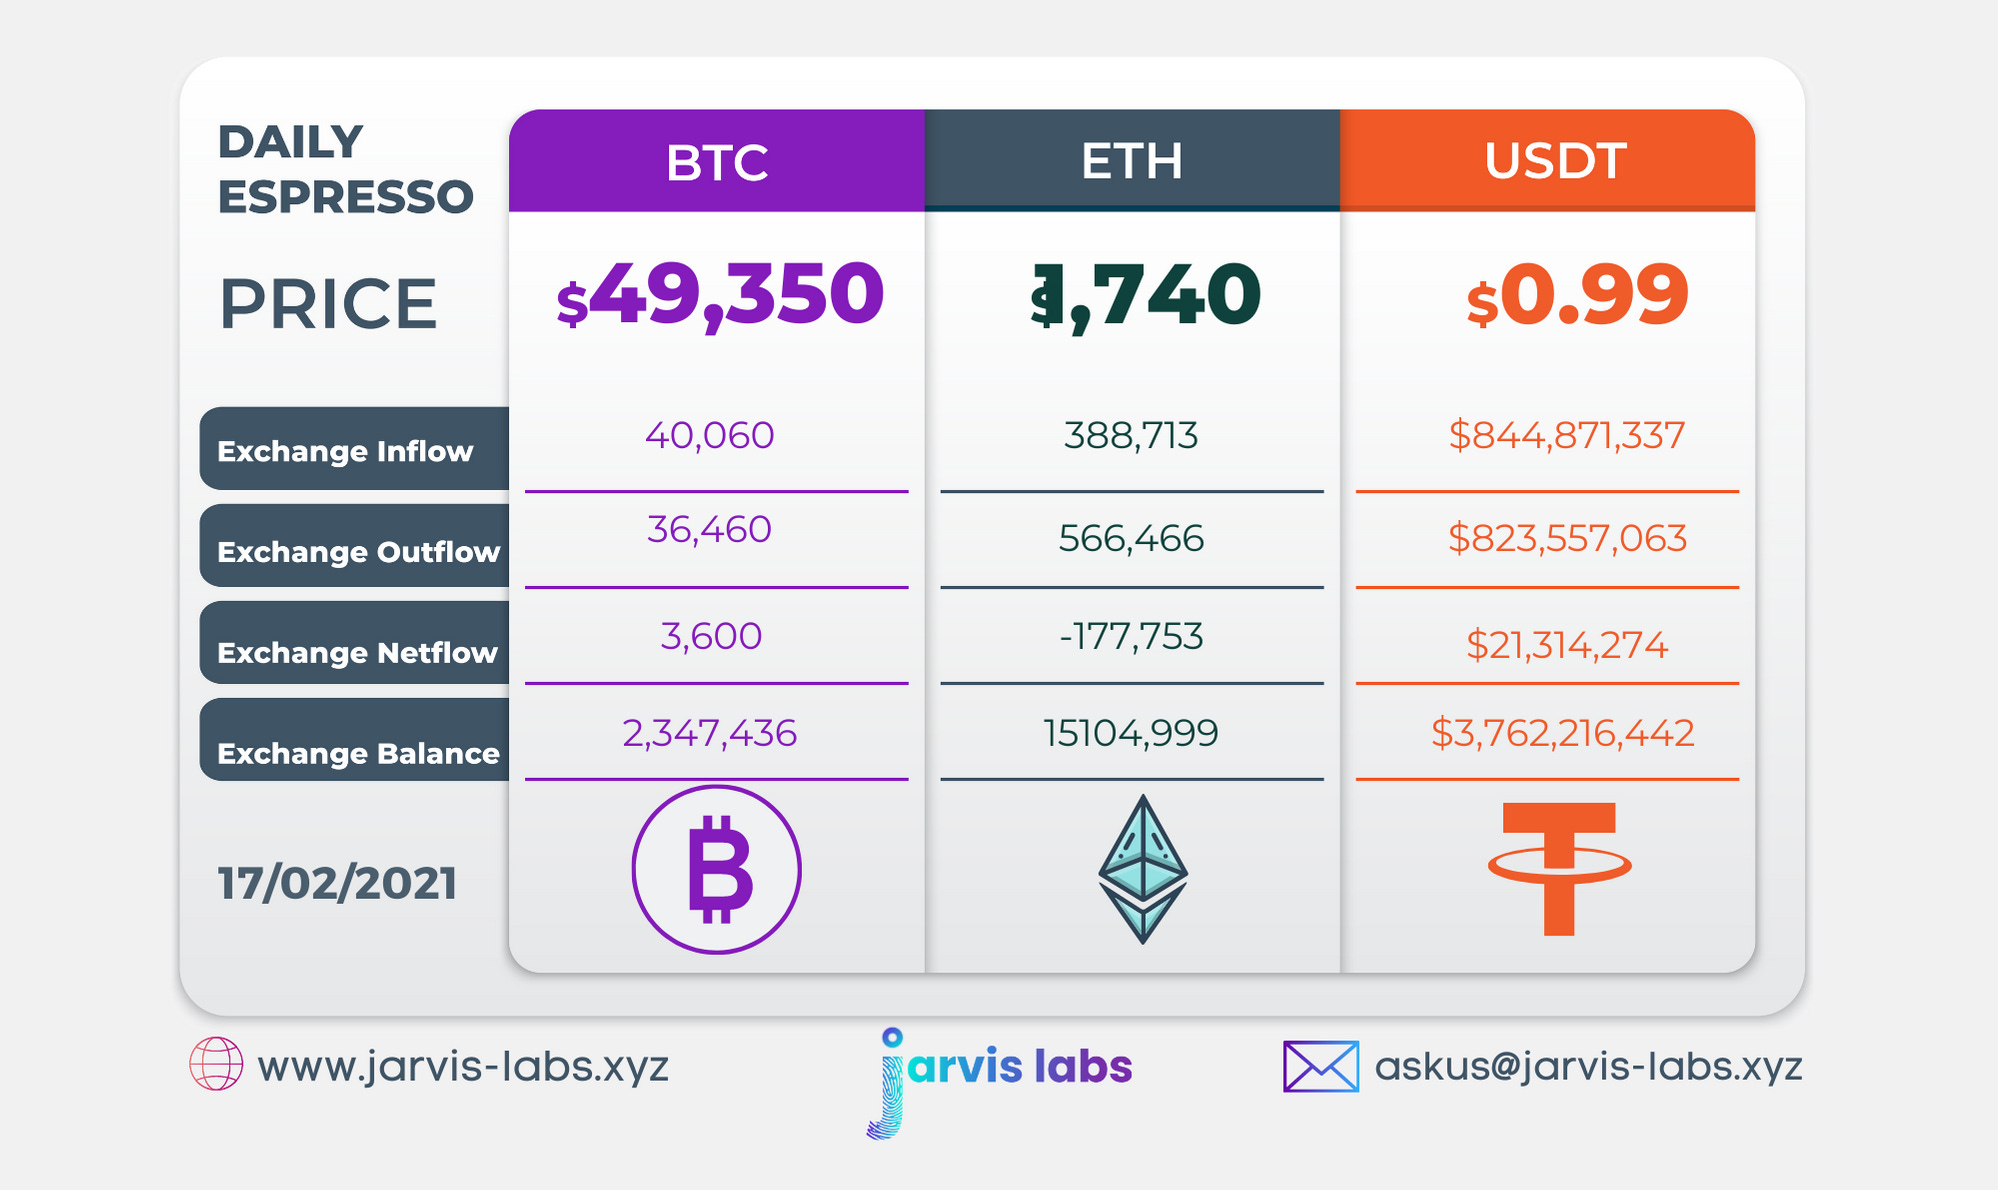
Below is our daily exchange flow data. This is a great gauge for understanding if BTC, ETH and USDT are flowing into exchange or leaving. If BTC and ETH are entering exchanges it can generally be viewed as bearish. The opposite scenario is bullish.
When USDT is flowing into exchanges it’s typically viewed as bullish. The opposite scenario is bearish.
This should only be used as a general gauge. Tagging the exact wallets these flows move into or out of helps improve the reliability of this data, which is what we do at Jarvis Labs. To date we have over 800 market mover wallets and 16 million wallets tagged all together. Consider us your on-chain trackers.