An Introduction to True Open Interest (True OI)


By Jlabs Digital (Benjamin and Koustav)
December 6, 2023
Abstract
This paper delves into the critical issue of miscalculations in aggregate open interest within cryptocurrency markets and misinterpretations that arise. The current methods used to calculate open interest lead to false conclusions about market structure and dynamics.
In this paper, we introduce an approach we call True Open Interest (True OI), which addresses current shortcomings in how open interest is measured. What the paper showcases is how True OI not only challenges conventional methods but also emerges as a powerful tool for better market analysis. Today, we will demonstrate how True OI, in contrast to traditional methods, accurately reflects the market’s real derivative exposure and highlights substantial differences in open interest changes.
By providing a clearer understanding of market conditions, True OI aims to become the industry standard, offering market participants a more reliable foundation for decision-making.
Background
The measure of aggregate open interest needs to be calculated differently. Current methods pose a problem that results in market participants drawing the wrong conclusion about what is happening in the market.
The issue stems from a common fact about metric creation for cryptocurrencies. What lens does the analyst view the market through? Is their main reference point the U.S. dollar, or is it the token itself (i.e., Bitcoin)?
This initial starting point creates assumptions about data that tend to be forgotten by the time a metric is viewed by a user, which results in decision-making from improper analysis.
This paper will discuss the metric of aggregate open interest and how it's been calculated, followed by the introduction of a new way of calculating aggregate open interest we call True Open Interest or True OI for short.
We expect True OI to become the market standard for viewing open interest in order to better understand the market’s current state.
Introduction
Aggregate open interest is a measure that shows the value of futures contracts being held in the market.
If a trader purchases a futures contract worth 1 Bitcoin on an exchange like Binance, this creates an open interest position equivalent to 1 BTC.
This means that if BTC is trading at $50,000, then this open interest in dollar terms is $50,000.
Already, we can see that open interest can be calculated in two ways. On the one hand, we can say the market’s open interest is 1 BTC. On the other, we can say the open interest is $50,000.
If no other contracts are opened and the trader continues to hold this contract while price moves from $50,000 to $60,000, we can see how the two perspectives begin to show contrasting insights.
No more contracts were created, which means the open interest in bitcoin terms is unchanged. But in dollars, we see the open interest has risen to $60,000 despite no new trades being opened. This can create a view that more traders are opening new positions in the market.
As we can see, that would be a false conclusion.
Additionally, if a short futures contract worth 1 BTC was opened at $50,000, and price then dropped to $40,000, the value of this futures contract would rise with the corresponding drop. This would wrongfully show both BTC- and USD-denominated open interest levels rising, despite no additional contracts being opened.
Multiply this miscalculation by the millions of BTC derivative positions open at any given time, and it’s easy to understand why relying on this data for an accurate reading of the market’s changes in net positioning is a recipe for trading strategy disasters.
True Open Interest
To combat this issue, Jlabs Digital created “True Open Interest.” True OI is calculated by taking the change or open interest delta, then multiplying it by BTC’s price at that time. This value is then added to the open interest on a rolling basis.
To showcase this difference, in the chart below, we have the price of Bitcoin, True OI, Conventional OI, and native OI.
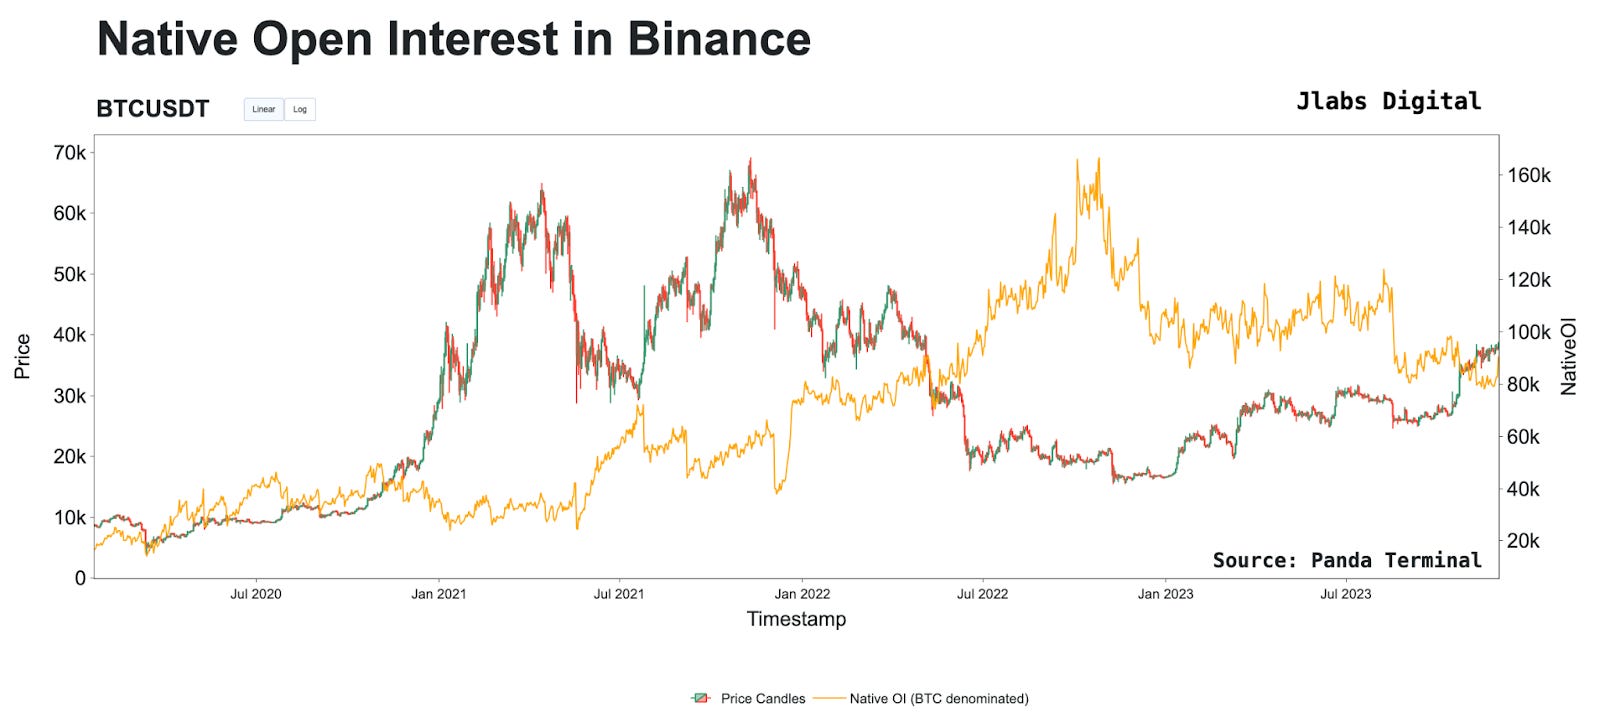
To set some definitions, native OI is the open interest measured in terms of Bitcoin. This means if the price of Bitcoin rises from $20,000 to $50,000, and only one Bitcoin contract is open, then OI (BTC) is equal to one.
For Conventional, this one open bitcoin contract would be $50,000 instead of $20,000 and reported in dollars. When you read headlines about several billions in OI being wiped out from a selloff, this is typically the value being reported.
What should stand out here is how True OI differs markedly from Conventional OI, but looks similar to OI in BTC terms. True OI is green, Conventional OI is burgundy, and OI (BTC) is yellow. This is a zoomed-out chart with all three versions on it, but we will show other charts that are easier to see momentarily. But for this section, let’s take a cursory glance at a few notable differences.
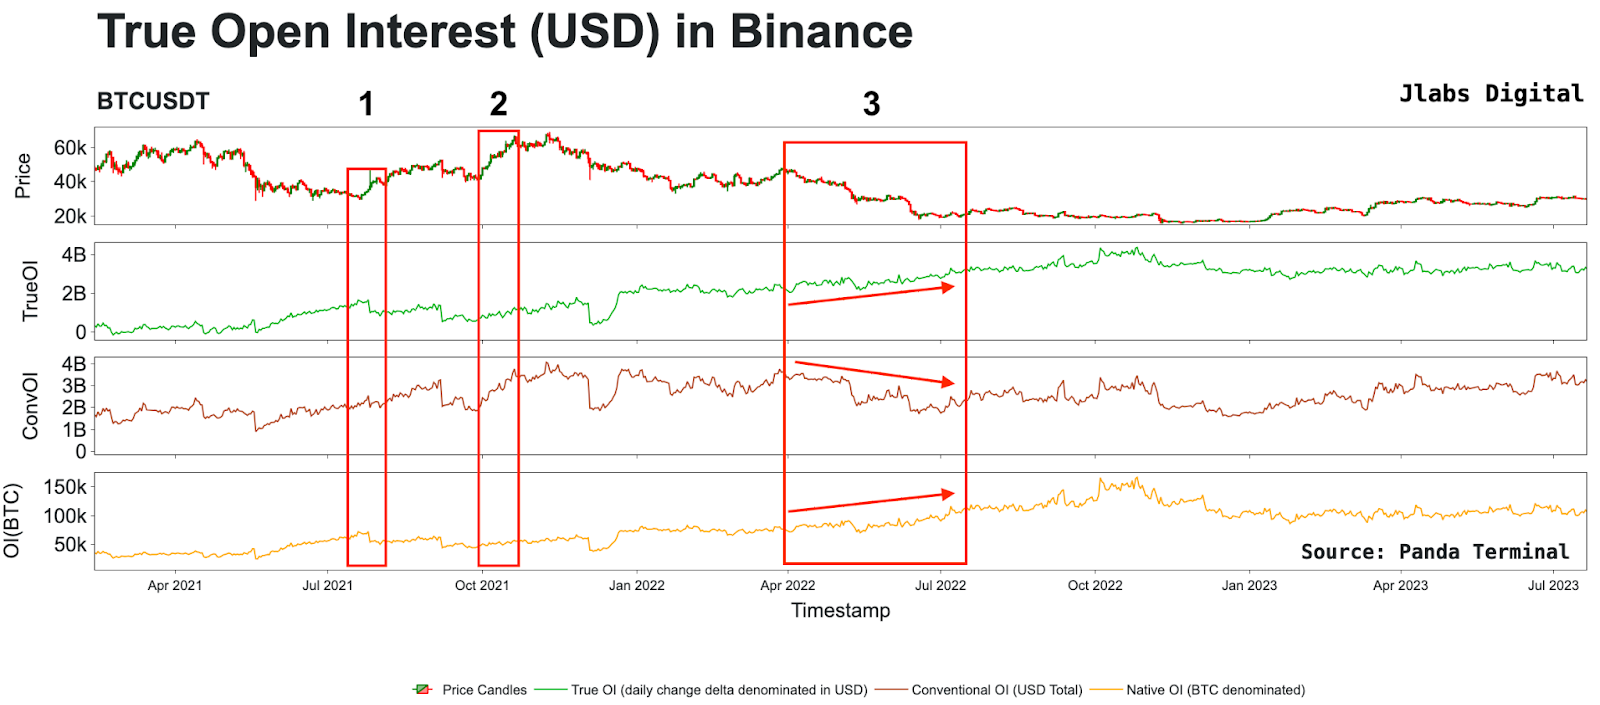
In the first box, we can see that in July 2021, traders were starting to show an interest in shorting the market.
For traders expressing downside bias, this is where the futures market comes in handy. That’s because spot does not express this bias as well and as directly as a futures contract.
But when price rises, the typical instrument is spot. It’s not leverage in the futures market.
This is why you see OI (BTC) and True OI have a lower reading in April 2021. But in June and July, open interest started to rise as market sentiment became bearish.
In box 1, we can see price rose, which impacted True OI and OI (BTC), as the price rise resulted in liquidations. But this had no impact on Conventional OI.
In box 2, we see True OI and OI (BTC) slightly impacted, while Conventional OI witnessed a surge in OI, which was incorrect. It was a byproduct of each Bitcoin rising in price.
In box 3, we see traders shorting the market, which results in rising OI. This is accurately reflected in True OI and OI (BTC), but not Conventional OI.
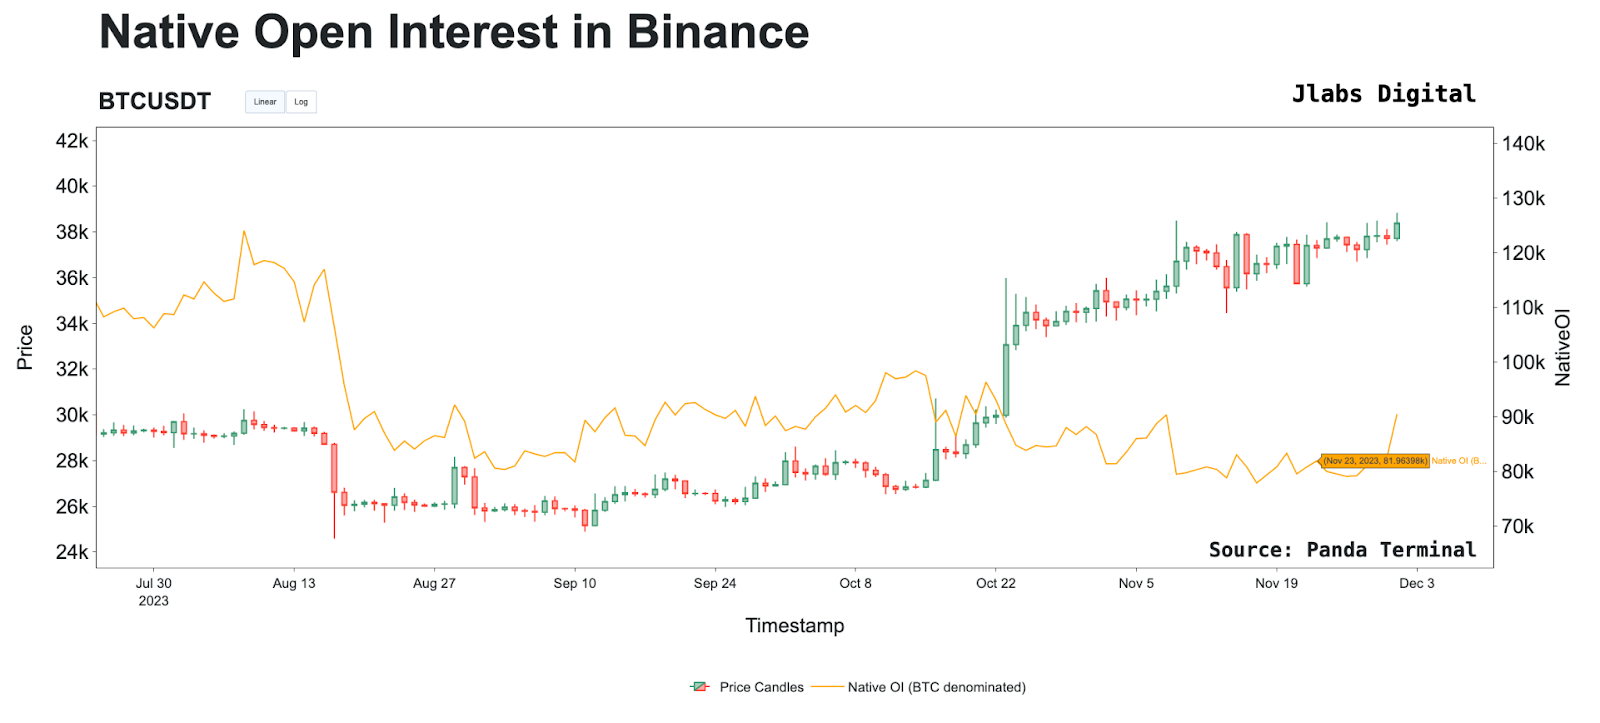
Here’s a more granular example from November of 2023.
Here, we see the Conventional OI methodology claiming that there is currently over $3.05 billion worth of futures exposure on Binance, up from $2.15 billion on September 1, 2023.
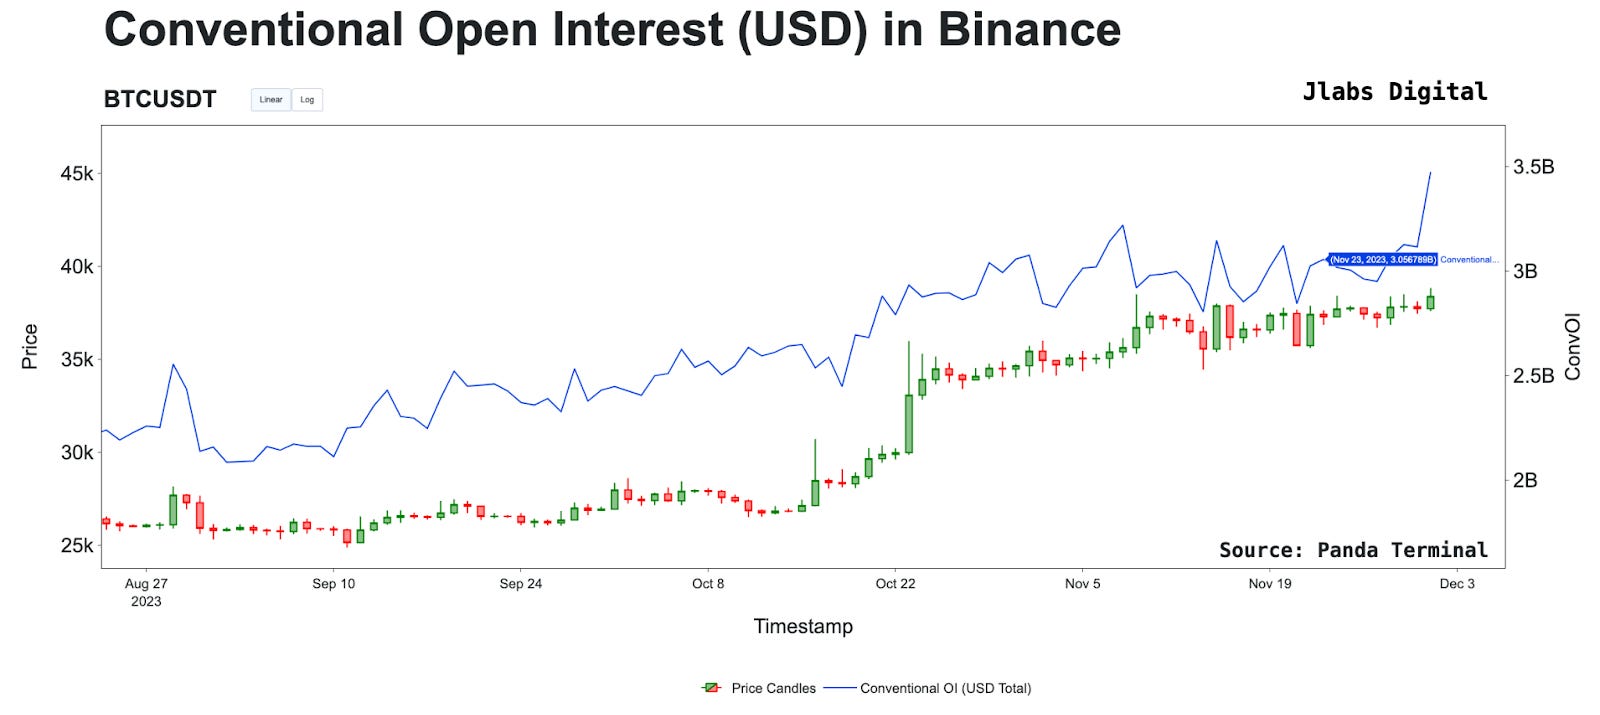
BTC-denominated OI reflects this same amount, with the $3.05 billion figure divided by BTC’s November 23 market price of ~$37,300. This gives us approximately 81.9k BTC.
True OI by contrast lays bare the real derivative exposure of traders on Binance, and shows us that the correct current total is $2.54 billion, a 17% decrease as compared to the conventional methodology.
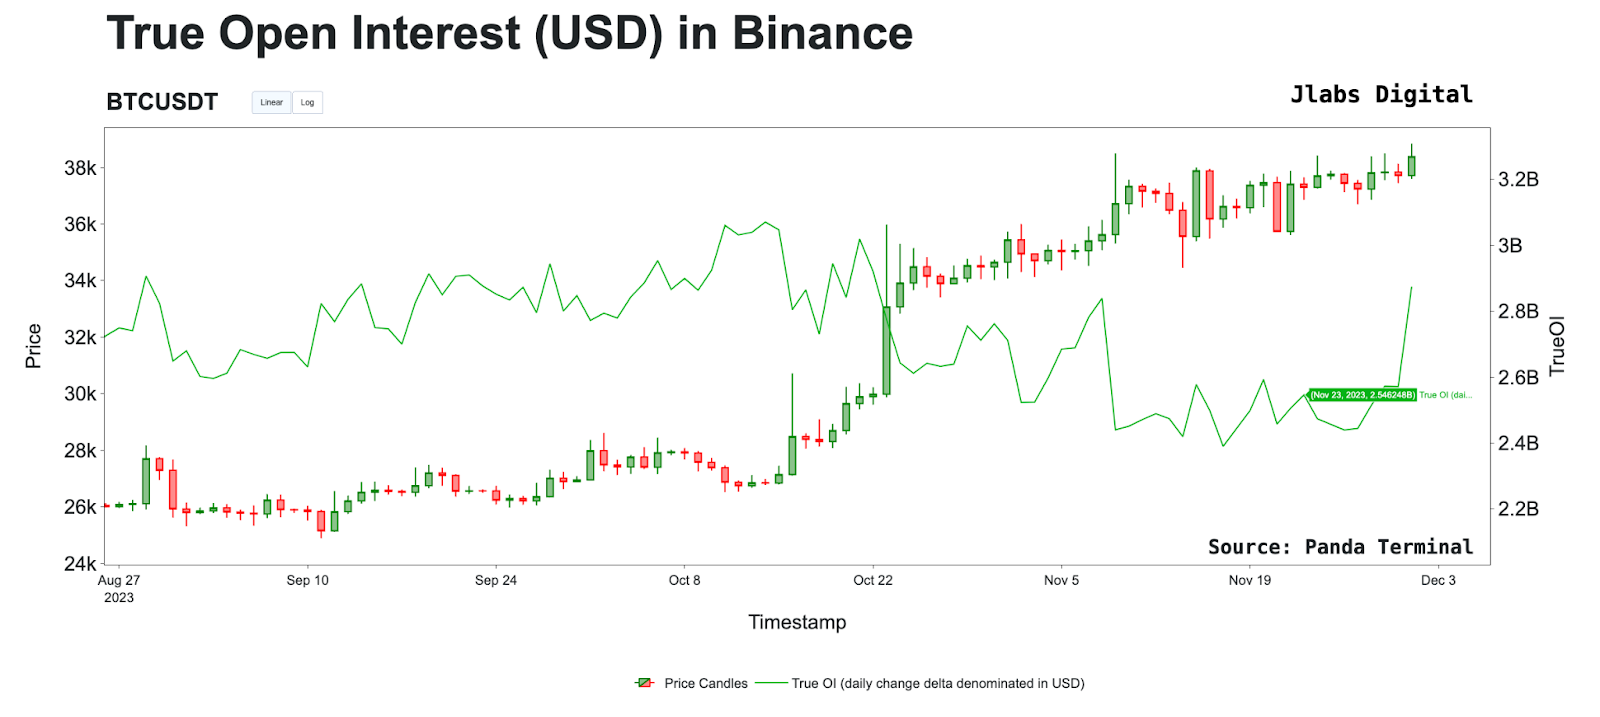
Additionally, True OI shows us that the correct change to open interest since September 1, 2023, when it was at $2.68 billion, is $140 million less, as opposed to Conventional OI, which reflects a nearly $900 million increase.
That’s a difference of more than $1 billion.
If a trader were relying on the conventional methodology, they would be led to the false conclusion that Bitcoin’s rally from ~$25,300 on September 1 to its November 23 price of ~$37,300 has been driven by speculative futures trading rather than spot purchases. This would give them the impression that current market structure is frothier than it is in reality.
True OI, meanwhile, shows us that as Bitcoin’s price has rallied since September, futures open interest has decreased. For a market, this is a bullish signal, since this indicates the recent price appreciation can be attributed to large purchases of spot BTC tokens rather than futures positioning, which would be more vulnerable to forced liquidations.
Conclusion
True OI is a more accurate way to measure open interest in the cryptocurrency derivative market.
The consequences of using conventional open interest calculations is likely to lead to market participants being incorrectly positioned at crucial times. Specifically, a participant might believe a market is being fueled by derivative trading versus spot, leading to an incorrect conclusion that a rally will be short lived.
The introduction of True Open Interest (True OI) not only addresses the shortcomings of conventional methodologies in calculating aggregate open interest but also serves as a crucial tool for accurate market analysis.
As demonstrated by its ability to reveal the real derivative exposure and changes in open interest, True OI stands poised to become the industry standard, offering a clearer lens through which market participants can make informed decisions.
Appendix
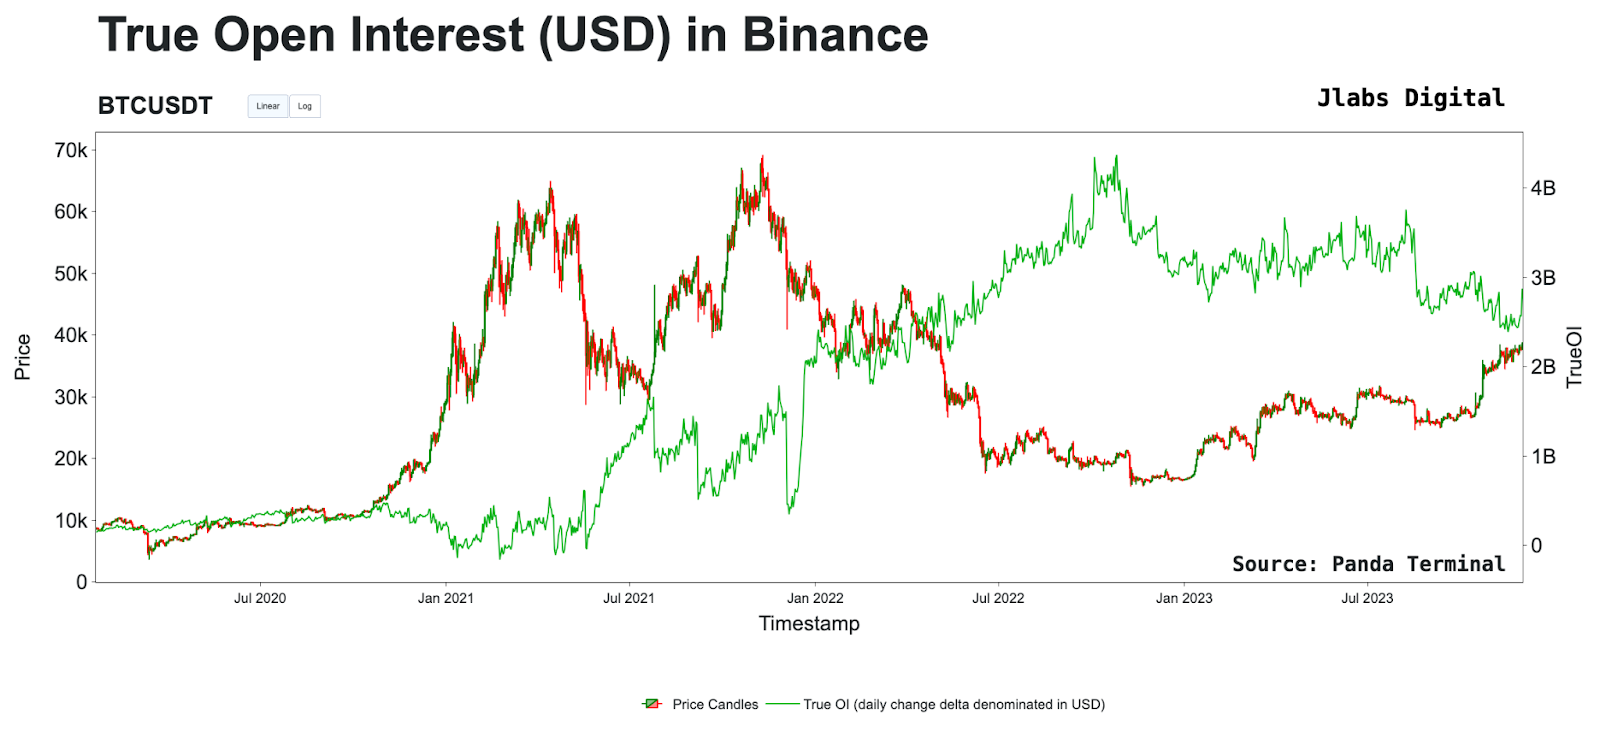
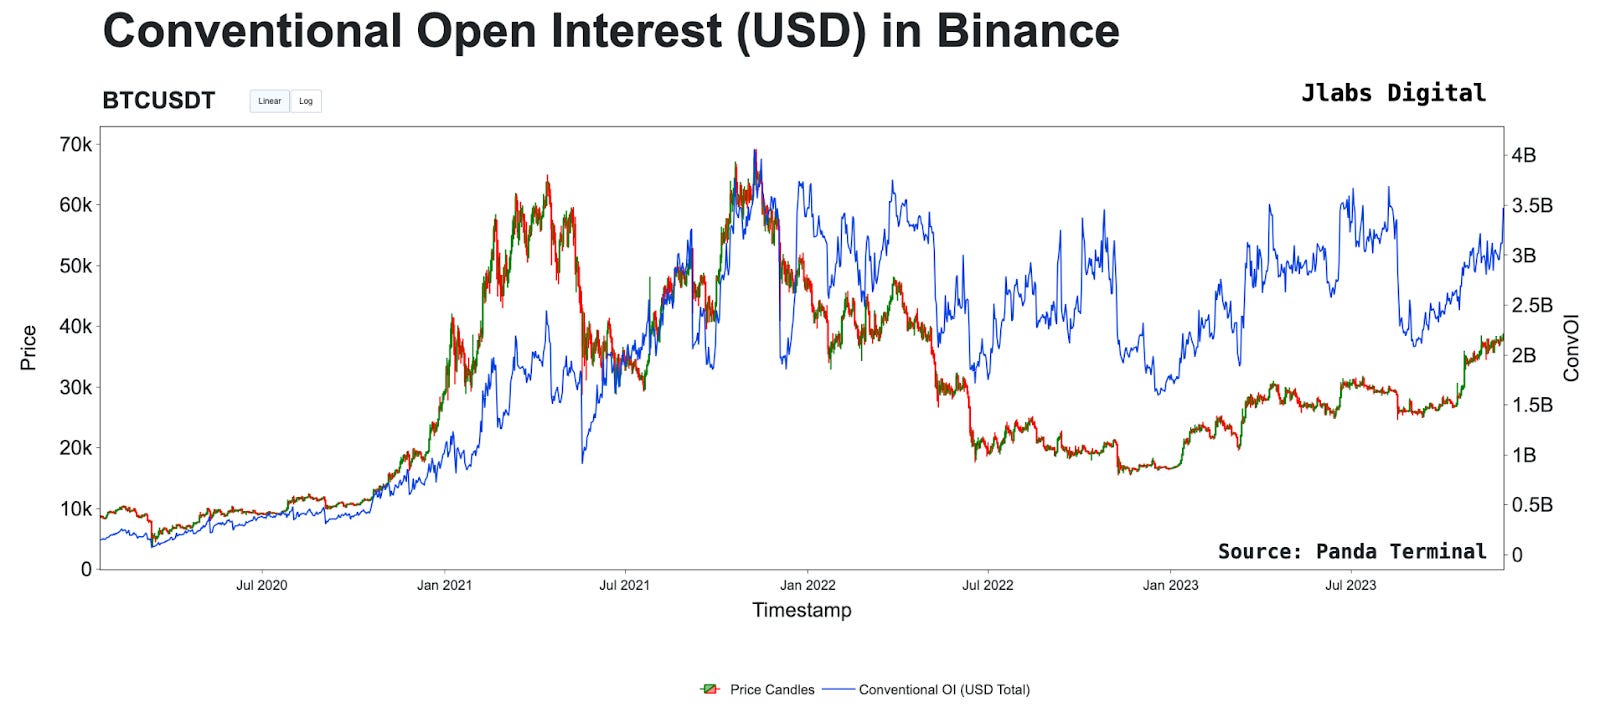
Here are the three versions fully zoomed out for reference.
True OI
Conventional OI
OI (BTC)