A Monetary History of the United States and Crypto, 2020-2023
The QTT Essays: Part One

Note From the Editor:
Since 2019, we’ve used Espresso to bring you market updates, onchain data analysis, and market commentary.
This began as a desire for Benjamin and myself (Ben Lilly) to have a more constructive and nuanced conversation with other market analysts. We found the approach to be more productive than spending time in various chat rooms.
Over time, a group of like-minded quants joined our efforts, helping us refine our views by exposing their weaknesses. And our commentary became more logical and detailed.
We were open sourcing our market views, so to speak.
During this stretch, Jlabs Digital (formerly Jarvis Labs) expanded. We started with just a few members, and now we number more than 30.
This team built new data infrastructure for ingestion and computation, trade engines, and models. Their capabilities evolved from simply pulling API data for trade flow to manipulating trillions of transactions for novel onchain metrics. I’m very proud of the work they’ve done.
Their accomplishments over the last year have unlocked what we think is the next phase of our conversation with you.
It is time for us to begin pushing the frontier of a more academic dialogue. I know, sounds boring…
But our view on what drives the market is rather expansive. We would like to get our theories on what drives the price of a token into the public domain. In doing so, we hope to find more like-minded teams or individuals who are ready to build or are already building with a more thoughtful approach.
Web3 systems can help build wealth globally. But that requires a thorough understanding on how any such “thingy” can impact price.
With that, I’d like to mention you’ll be seeing more theoretical dialogue coming from me.
This type of dialogue starts today. Hopefully, you enjoy these pieces as they will lay the foundation of how our team evaluates tokens.
And don’t worry, these evaluations and analysis will continue to make their way into Espresso. They will also form the basis for a research product we are in the midst of preparing called Token Ratings by Jlabs Digital.
That’s right, the team is gearing up for a research product offering.
Part of this was in response to several requests for us to produce sell-side research. The other reason is we believe sharing our research with a smaller cohort can unlock more nuanced conversations with those eager to follow along. It’s the next progression of our journey.
More on that soon.
For today, let’s talk about money.
If there is one foundational question that affects how we design our metrics, it’s this:
“What is money?”
Specifically, what makes people use it, spend it, or hold it. It’s a mental exercise that helps us better grasp the dynamics of regular government-issued dollars as well as cryptocurrency tokens.
Some people might think these principles don’t apply to the latter. But we prefer to view cryptocurrency tokens as just a natively digital currency. Meaning many of the same definitions and mental models for traditional currencies that have been around for generations can be applied to our neck of the woods.
Instead of taking the time to give you a high-level oversight on what we allude to, let’s just get right to the point.
Inflation Is About More Than Just Supply
Money has various use cases.
We can light it on fire to stay warm, use it to make origami, pay for a candy bar, store wealth, deposit it as collateral, or spend it to purchase securities.
Each use case is distinct. And the popularity of each use case signals to the market the money’s value.
If in one region of the world money is predominantly used as fuel for a fire, then its value is likely similar to the material it’s composed of. Meanwhile, if another region of the world uses their money to generate a yield… the two likely have widely different values.
Viewing this difference in money might seem odd. After all, we’re talking about money. We mainly use it to buy stuff… Right?
Well, the data says something different… And what it says changes over time.
To help explain what we mean here, let’s try to remember our mental state on March 16, 2020 – the COVID crash.
If you’re having trouble recalling that day, the Dow Jones Industrial Average had just lost 12.9% that day. Markets were so bad they were literally shutting down.
The economy at large was in a similar situation. Businesses were closing, employees were sent home, and uncertainty was at extremes. It was a moment where dollars in your hand meant far more than anything else.
In fact, the savings rate in the U.S. skyrocketed from 7.2% to start the year to 32% in April… double the previous highest savings rate, according to the Federal Reserve.
The predominant use case for dollars going into the summer of 2020 was for holding.
In crypto, we view this as the hodl metric.
Now, holding money to this degree was a massive behavior change at the time. The impacts of which are clear as day now.
Fewer dollars sloshing around the economy and being used to buy goods and services meant inflation was negligible.
At the beginning of 2020, inflation was at 2.5%… By April, when the behavior switched from “normal” to “holding,” inflation dropped to 0.3%, and even fell to 0.1% in May.
This change in money usage directly impacted inflation.
Meanwhile, the amount of dollars in circulation, as measured by M2, went from $15.4 trillion at the beginning of March to more than $17 trillion in mere weeks. And when it comes to such massive surges in the supply of money, we tend to think inflation immediately follows. But it didn’t.
If anything, all this freshly minted money was acting as inflation kindling. But it needed a match.
That match was a shift in the dollar’s usage.
In the boring world of economics, we express this change in mentality through a mental model called the Quantity Theory of Money, or QTM for short. This idea was popularized by economists Anna Schwartz and Milton Friedman in their seminal book, A Monetary History of the United States, 1867-1960.
The title may sound like a textbook, but the concept isn’t that hard to understand. Think of it this way. It basically says the amount of money in the economy, multiplied by how much the currency is being used (e.g., velocity, which is the opposite of the savings rate), will impact the worth of the currency.
More money, but a lot less spending, means no inflation.
More money, but more spending… Well, that’s the type of situation where the match lights our proverbial kindling. Which brings us to our next mental state.
The 2021 Summer Bingefest
Just a year after the COVID lockdowns went into place in 2020, they were coming to an end in summer 2021. Economies globally were beginning to open back up. Concerts were being planned… Parades… it was a “school’s out for summer” type of feeling.
The idea that we no longer needed to hoard money out of fear of losing a job or needing to get by was gone. The mentality around money shifted.
Before, people had become like doomsday preppers hoarding twinkies during the Cold War. Then all of a sudden, it’s as if everybody found out there were no nukes to be concerned about.
It was Twinkie binge time.
This shift in mentality caused the savings rate to plummet from 26.1% to under 10% in two months. Here is the savings rate with May 2021, the start of the summer 2021 bingefest, highlighted for reference…
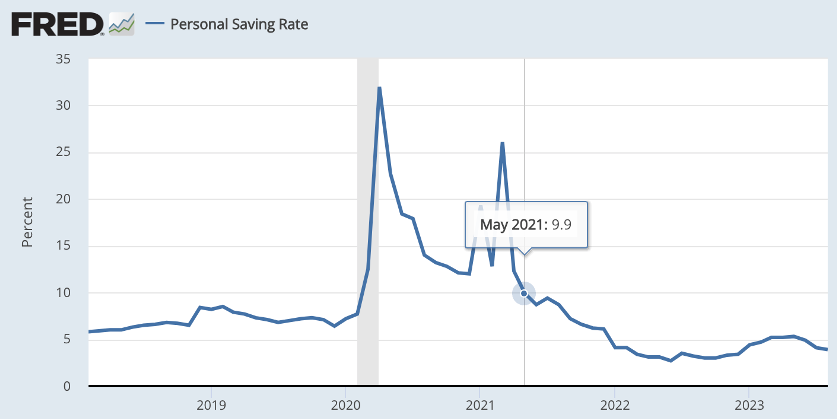
As you can see, the savings rate not only began plummeting… But dropped below pre-pandemic levels later that summer.
Dollars were not for holding, but for spending. Which is to say, dollars were less about storing wealth, and more about using it as a method of payment.
More money, met with more spending…
The boogeyman of inflation had arrived.
Here is inflation on a chart. I’m guessing you can tell what period that red arrow is highlighting – 2021 Summer Bingefest.
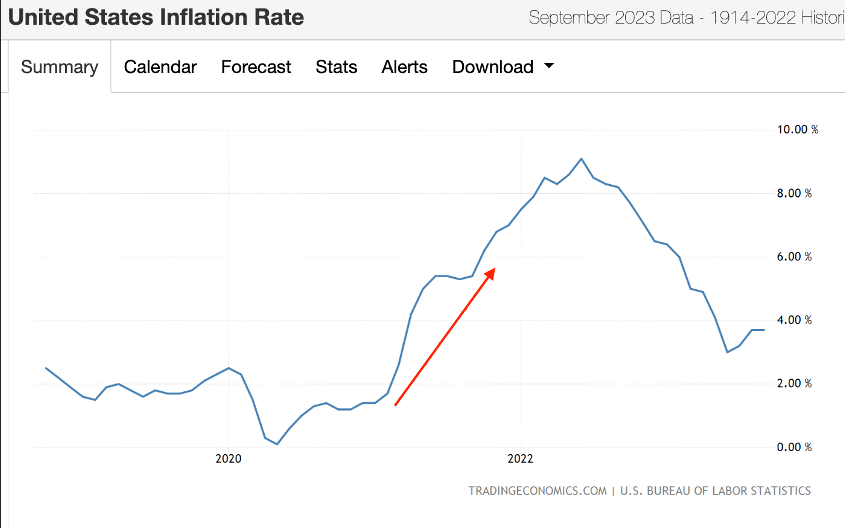
Inflation at the start of 2021 was 1.4%... By May, it was already hitting 5%.
It’s as if U.S. dollars were hot potatoes. Nobody wanted to hold them.
Looking back at that time, you can probably remember buying something you really didn’t need. This might have been a bigger TV, a computer monitor, some luxury work-from-home office chair, or even some remodeling work on your home. The binge was real.
Whatever your purchase of regret was during your child-like shopping spree…
Don’t you wish you kept those dollars in your pocket? I mean…
That dollar now pays you 5%. Imagine if you took your wealth at the start of 2022, placed it into dollars, and now earned 5% on it. My guess is you would be a little happier with yourself.
Which brings us to the most recent change in mentality regarding usage…
The Dollar Becomes a Hodl Asset
If we look back at that inflation chart from earlier, we can see inflation peaked in June 2022 at 9.1%.
It’s almost impossible to conceive how the economy allowed inflation to go from 0.1% to more than 9% in a year. The predominant form of money usage matters. And with our next change in usage, you’ll see it again.
Below is the savings rate chart from above, with more of a focus on the post-COVID period. We can see the chart bottoms out in June 2022 – the same month that inflation peaked.
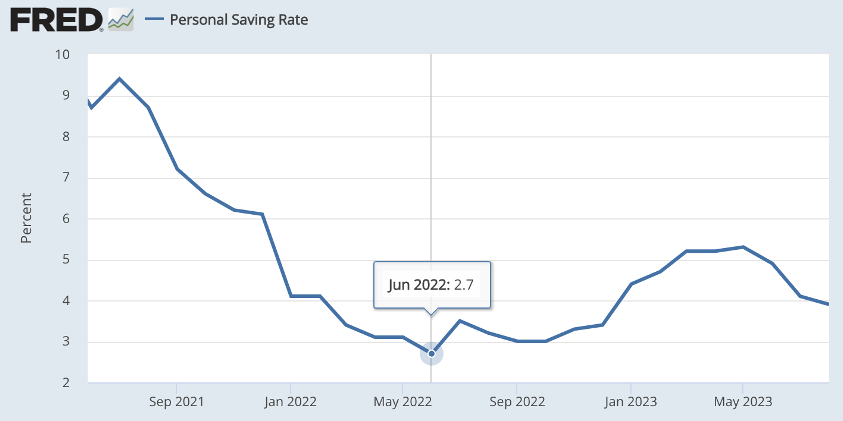
Yet, the supply of dollars had barely changed… It wasn’t a sudden shrinking of supply that caused inflation to reverse. So what happened here?
The Federal Reserve changed the market’s behavior.
The central bank raised its borrowing rate three times in the first half of 2022. In March, it was a small uptick. Then in May and June, we saw the borrowing rate go from about 0.25% to 1.5%. It was drastic.
This major move resulted in dollars sent to the U.S. government for lending purposes (i.e., Treasury buying) to receive an actual cash flow. Lending out those dollars just before 2022 would net you 0.25%. Meaning $250 on every $100,000 lent.
But by June that year, that same $100,000 was earning more than $3,100. That’s 1,140% greater cash flow than six months prior. It was significant.
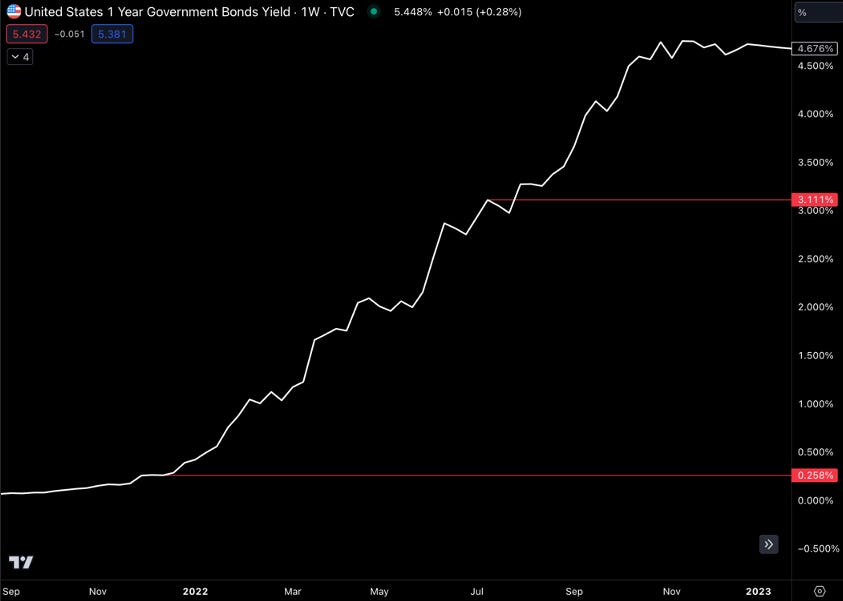
So the market’s preference in terms of how to use dollars shifted. Dollars became more about earning a significant cash flow rather than spending them on goods and services. Sure, it helps that the dollar’s strength is rising, but nonetheless, this is the primary usage of dollars today.
People want to earn yield on an asset with price stability – take note, token economists. We even see several projects bringing this yield exposure to public blockchains. That’s how popular it’s getting.
As a result, we have a similar amount of dollars in supply, but now, they’re being spent less… Inflation has now been below 4% for four months as I write this in October 2023. And if anything, more people want to hold dollars than ever before.
We can see this based upon the rising demand in the Treasury market. In the charts below, each colored line denotes a U.S. Treasury term. The height of the line is the amount bid for each term during each month. The shaded area of each bar is the amount of bids awarded by the U.S. Treasury.
I mentioned earlier that in the last four months, inflation has been below 4%. For the last six to eight months, the amount of money getting bid at Treasury auctions has been rising.
Here are auctions for U.S. Treasuries with terms of 52 weeks or less.
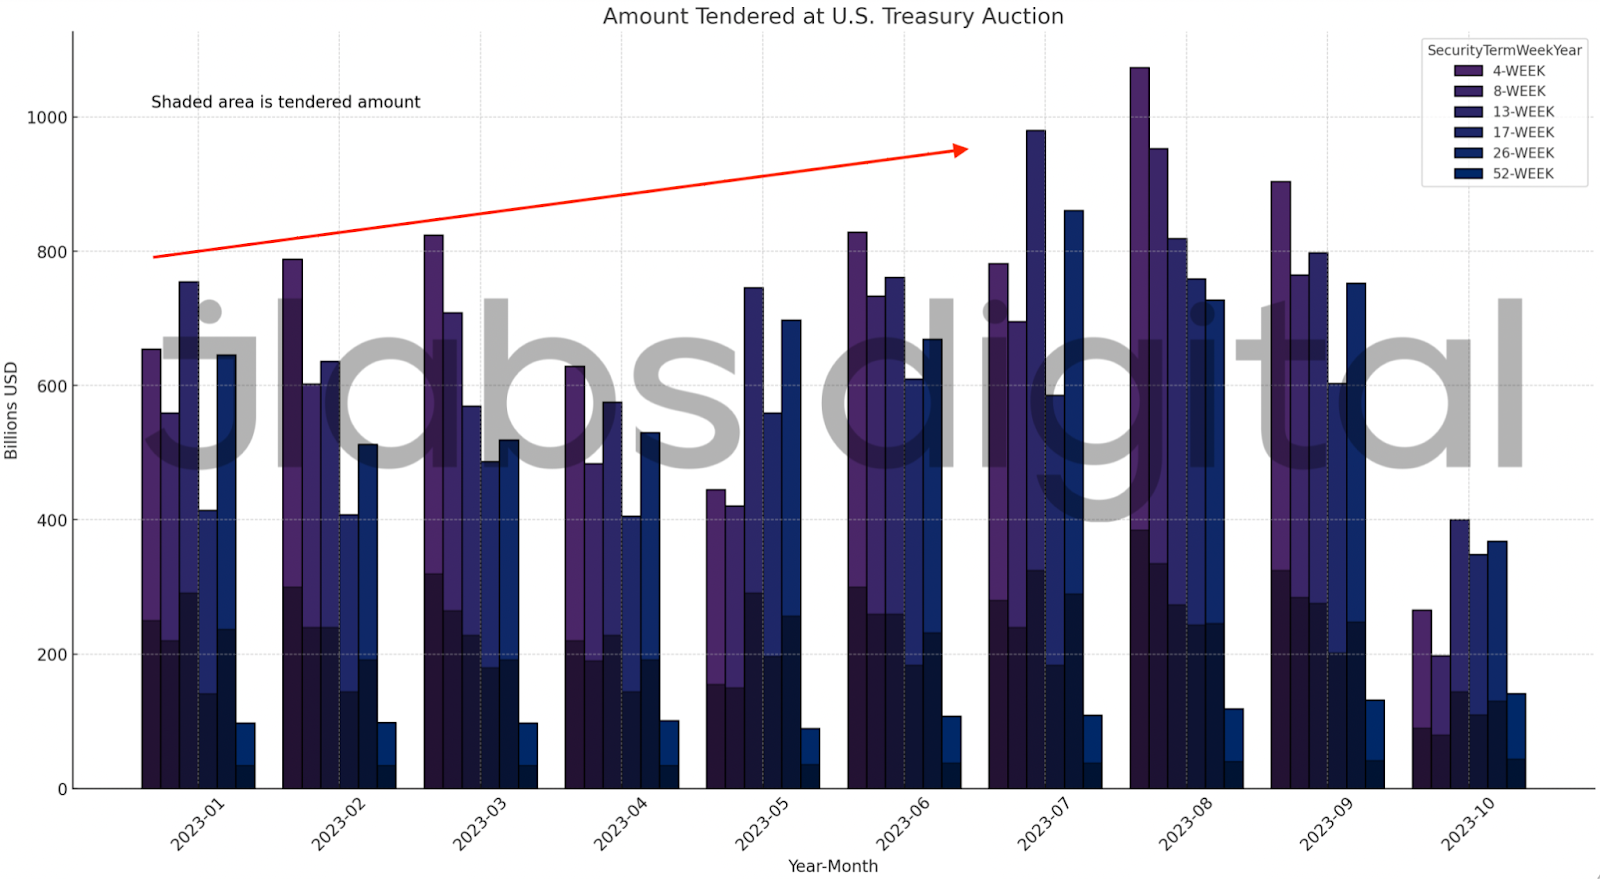
Here are auctions for Treasuries with terms longer than 52 weeks.
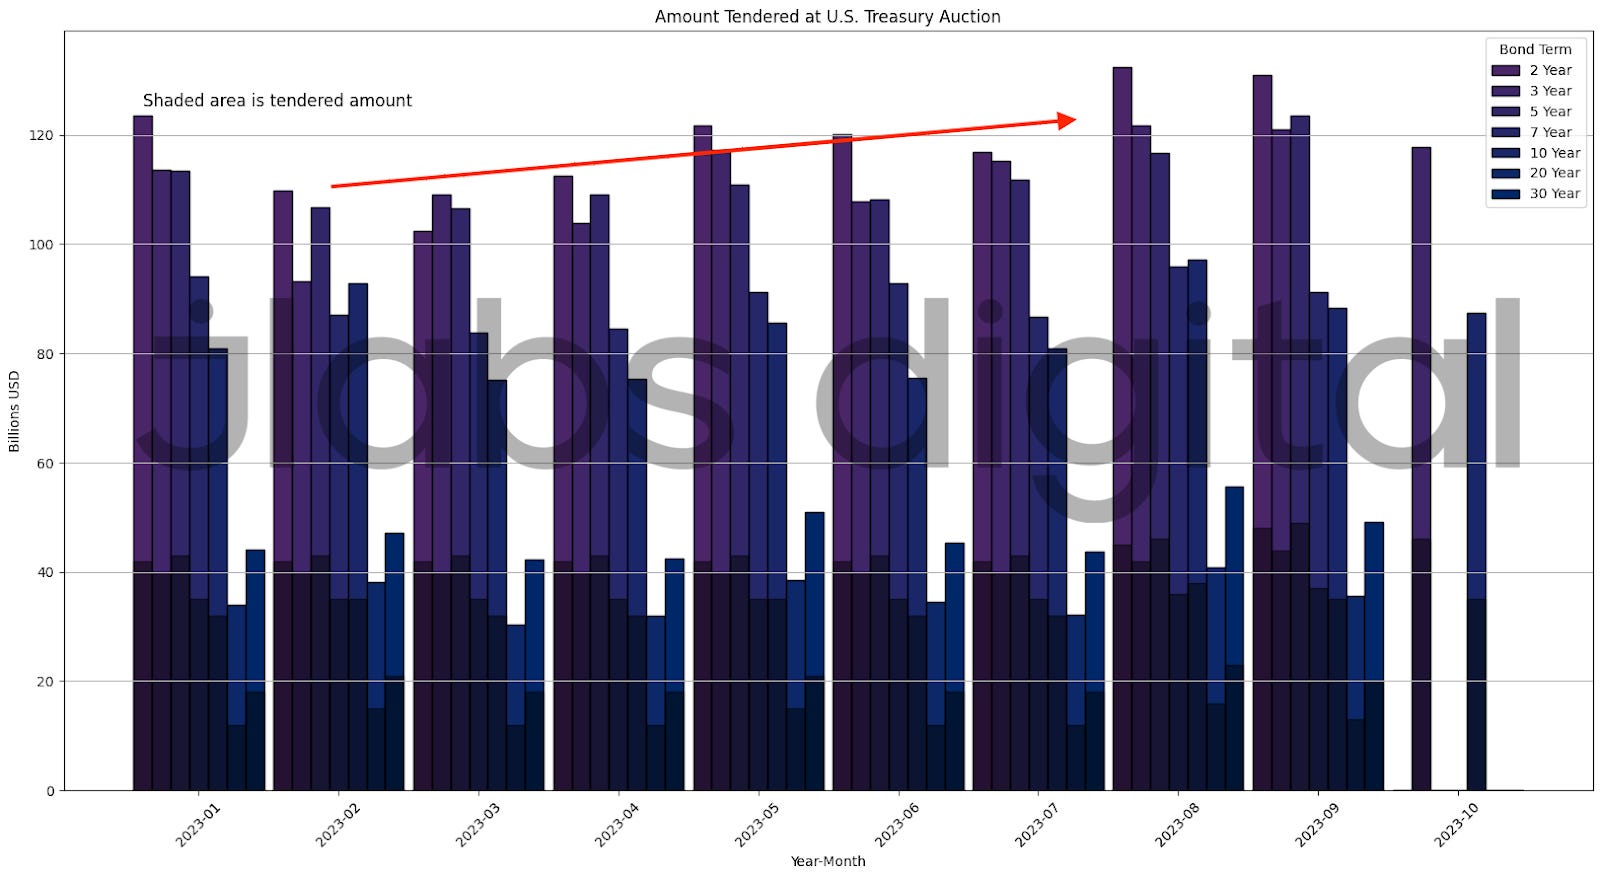
What these two charts illustrate is rising demand for using U.S. dollars to earn cash flow. It’s essentially “hodling” on steroids.
In the summer of 2020, the population was holding out of fear. In 2023, the population of U.S. dollar holders is holding to generate cash flow. It’s a more productive usage of the currency.
This is why the version of QTM I endorse for crypto focuses not on quantity, but on quality. I call it the “Quality Theory of Tokens.”
There’s More to the Story
This might have seemed like a lot of information.
But we can summarize things by going back to the timeframe of March 2020, and thinking about how money usage changed in the years that followed.
It progressed from a holding state, to a spending state, to a state where the money generated a yield.
During this progression, inflation went from very low, to very high, to lower again.
Meanwhile, the amount of money in circulation did not have a direct impact on inflation. Which means the supply of money didn’t impact the price of those same dollars as much as the usage of those dollars did.
Next time, we’ll dive more into how Schwartz and Friedman’s definitions of money supply can help us better understand how money is being used, by thinking of things in terms of liquidity and usage.
And those definitions can also be applied better analyze tokens relative to themselves, instead of another currency that is subject to its own changes day-to-day.
In other words, we’ll expose the limitations of framing every crypto in terms of the U.S. dollar – and offer a better alternative.
Look out for part 2 in your inbox on Thursday.
Until next time…
Your Pulse on Quality Crypto,
Ben Lilly